


(C) 2012 Raimo Virkkala. This is an open access article distributed under the terms of the Creative Commons Attribution License 3.0 (CC-BY), which permits unrestricted use, distribution, and reproduction in any medium, provided the original author and source are credited.
For reference, use of the paginated PDF or printed version of this article is recommended.
A protected area network should ensure the maintenance of biodiversity. Because of climate change, species ranges are expected to move polewards, causing further demand for the protected area network to be efficient in preserving biota. We compared population changes of different bird species groups according to their habitat preferences in boreal protected areas in Finland on the basis of large-scale censuses carried out in 1981–1999 and in 2000–2009. Population densities of common forest habitat generalists remained the same between the two periods, while densities of species of conservation concern showed contrasting trends: species preferring old-growth forests increased, but those living on mires and wetlands, and species of Arctic mountains decreased. These trends are most probably connected with climate change, but successional changes in protected areas and regional habitat alteration should also be taken into account. Of species preferring old-growth forests, a larger proportion are southern than among species of mires and wetlands, or of Arctic mountains, most or all of which, respectively, had a northerly distribution. In general, northern species have decreased and southern increased with the exception of northern species of old-growth forests which had not declined. On the other hand, bird species of mires and wetlands decreased also in the northernmost protected areas although mires had not been drained in the region in contrast with southern and central Finland thus indicating that regional-scale direct habitat loss did not cause the decline of these species in the north. It is suggested that climate change effects on species in natural boreal and Arctic habitats most probably are habitat-specific with large differences in response times and susceptibility.
bird species, boreal, climate change, conservation concern, mire, old-growth forest, protected area network
A protected area network should ensure the maintenance of species and communities. However, a reserve network is rarely adequate for this purpose (
Climate-change-driven range shifts are probably among the most dramatic at northern latitudes because of the greater temperature increase projected for these regions (
An important issue for future conservation planning is what the functionality of the present protected area network is in the face of climate change (
In northern Europe, the boreal landscape has been intensively utilized; in particular, forestry, alongside agriculture, is the major use of land in vast areas. Natural, old-growth forests have been logged and mires drained for forestry and agricultural purposes. In Finland (Fig. 1) both mires and old-growth forests, in particular, have been regarded as focal habitats for species and communities in terms of conservation, and specific protection programs for both of these habitats have been launched and implemented (
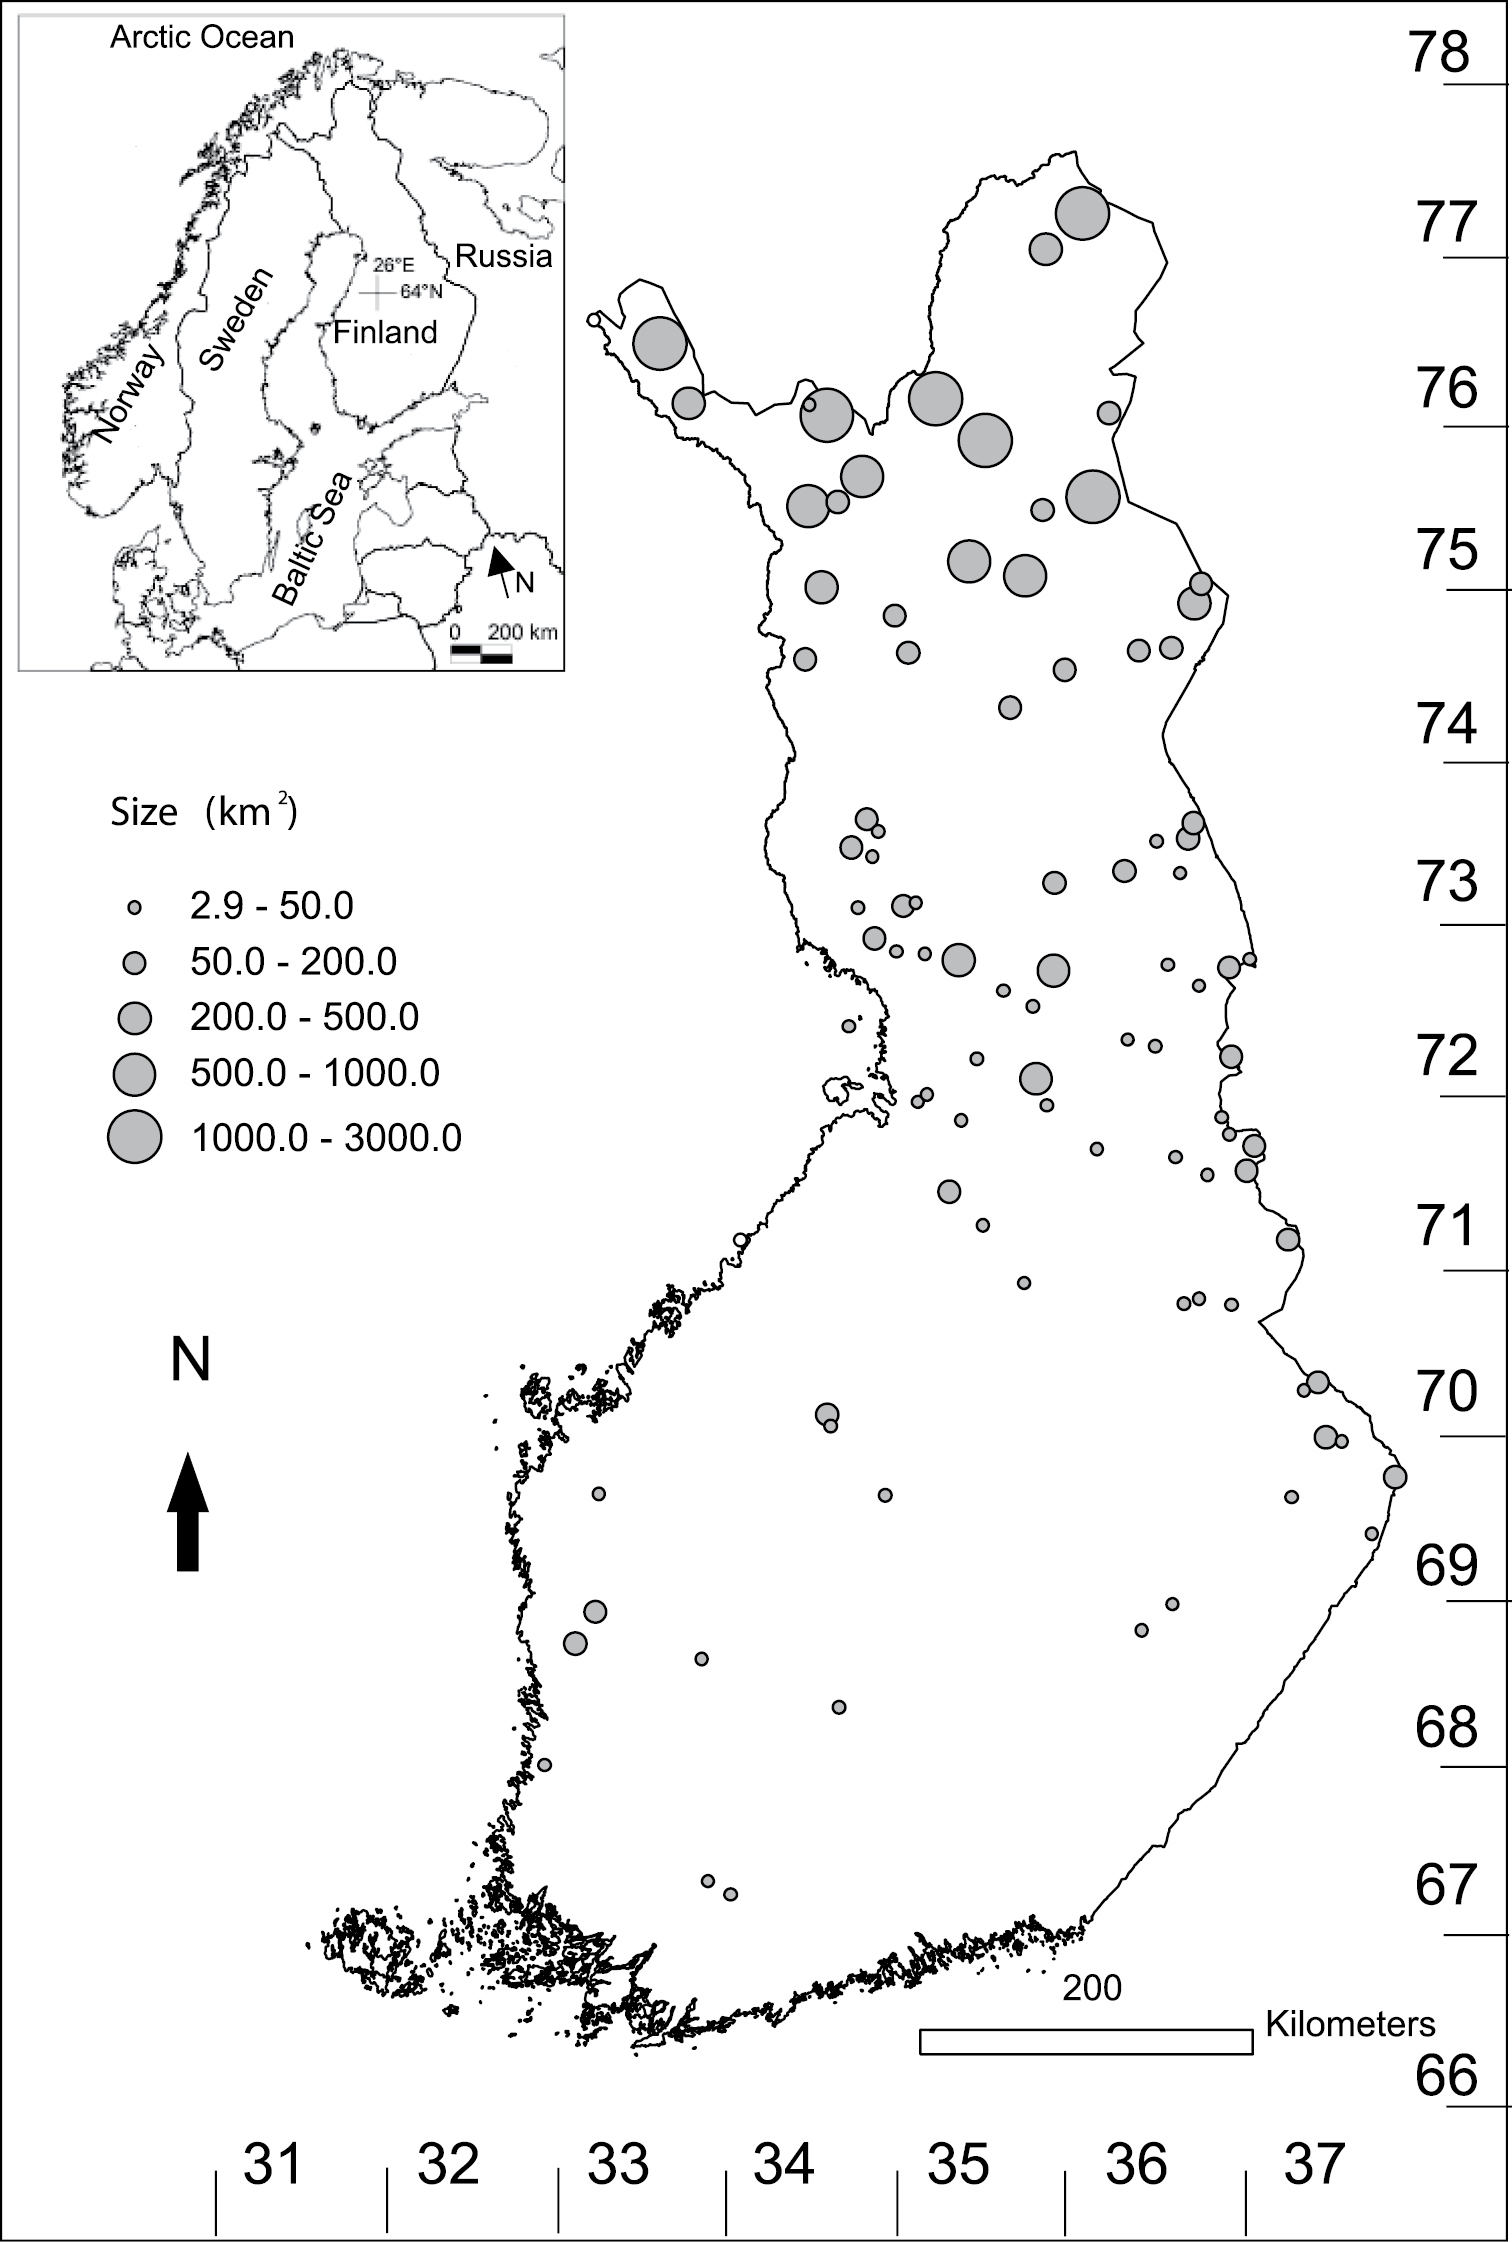
Location of the protected areas in Finland, where bird censuses were carried out both in 1981–1999 and in 2000–2009. Uniform grids (Uniform Coordinate System) used in Finland are presented.
Direct habitat loss outside protected areas may influence populations of species of conservation concern in protected areas, such as birds breeding on mires and wetlands in southern and central Finland, where over 70% of mires have been drained (
In this work, we compare in Finnish protected areas population changes of different bird species groups, which are classified according to species habitat preferences. We compare densities by referring to large-scale bird censuses performed in 1981–1999 and in 2000–2009. We have previously shown that northern bird species had declined and southern species increased between the two time slices (
Because land use intensity outside protected areas is different in the different parts of the country, we compare population changes of bird species groups also by taking the location of protected areas into account in order to separate the possible effects of regional habitat alteration (direct habitat loss and degradation outside protected areas) and climate change effects. If regional habitat alteration was the primary cause for population changes, the negative population changes should be more pronounced in the southern than in the northern protected areas both due to more intensive land use outside protected areas and smaller size of reserves in southern Finland. On the other hand, as a consequence of warming climate southern species are predicted to increase and northern species to decline (
The total area of reserves (N = 96) in Finland (60–70°N, 21–31°E, Fig. 1) in which bird counts were done was 22, 493 km2, with the protected areas studied ranging in size from three to 2, 524 km2 (mean = 234.3 km2, median = 51.6 km2). Logging or drainage of mires is prohibited in the protected areas, so forestry is not allowed in these areas. Reindeer herding is a common use in northern Finnish protected areas. The protected areas studied accounted for over 60% of the land area of Finnish protected areas. Six areas were smaller than 10 km2 and six larger than 1, 000 km2. The latter largest areas included four wilderness areas and two national parks in northernmost Finland. Twenty-four protected areas were studied in the southern half of Finland (total size: 910 km2) and 72 in the northern half (total size: 21, 583 km2, see Fig. 1). Most of the protected land is in northern Finland (
Land birds in protected areas were counted by means of the Finnish line transect census method (
The census is carried out in June in the early morning, when the singing activity of birds is highest. In the line transect method, a 50-meter-wide main belt along the walking line (25 m on each side) and a supplementary belt outside the main belt are separated. The latter covers all birds observed outside the main belt (e.g.,
Densities of bird species (pairs/km2) were calculated on the basis of observations in the whole survey belt, including both main and supplementary belts. Species-specific correction coefficients were used in the density calculation. These coefficients vary according to the proportion of main belt observations to all survey belt observations.
The density of a species (D, pairs/km2) based on the Finnish line transect census was calculated as:
D = K × N/L, (1)
where K = species-specific correction coefficient, N = number of observations of a species on the whole survey belt, and L = transect length (in km). The species-specific correction coefficient (K) was calculated as (
K = 40 – 40 √ (1– p), (2)
where p = proportion of main belt observations (range 0–1); for details of the calculations, see
The species-specific correction coefficient takes into account the differing audibility and other detectability of different species (
The total length of line transect censuses in the protected areas was 6, 587 km in 1981–1999 and 5, 087 km in 2000–2009. Birds were counted in 96 areas, in which in both periods the total length of transects was at least 10 km (see Fig. 1). The median total length of transect kms in a protected area was 45.0 km in 1981–99 and 33.6 km in 2000–2009. The mean number of years that censuses were carried out in each protected area was 3.7 (median = 3) in 1981–99 and 2.4 (median = 2) in 2000–2009. The median census year was 1992 in the first and 2006 in the second period, making the average time span in the study 14 years. The same transects were not repeated, but censuses in each protected area included the same proportion of habitats in the two periods. Transects covered all main habitats in each studied protected area relative to each habitat’s proportion.
Bird species were divided into classes according to habitat preferences, in line with the classification applied by
The study used, all told, seven groups of species categorized by habitat preferences (see Appendix): (1) forest habitat generalists, (2) species of coniferous forests, (3) species preferring old-growth or mature forests, (4) species preferring deciduous forests and bushes, (5) species of mires and wetlands, (6) species of cultivated areas, and (7) species of Arctic mountain heaths. Many species of cultivated areas also breed in natural habitats such as the fieldfare Turdus pilaris and hooded crow Corvus corone cornix in forests or the curlew Numenius arquata on mires. In total 148 species were included in the analyses. All land birds observed along the transects were included in these habitat preference groups except the swallow Hirundo rustica and the house martin Delichon urbica, which breed on buildings and were excluded.
Bird species were categorized also according to their distribution (see Appendix). Distribution pattern (southern or northern) was classified in terms of distribution and regional density variation in Finland (
Densities of species between the two time periods were compared pairwise in each protected area via either paired t-test or non-parametric Wilcoxon signed rank test. A non-parametric test was adopted when the prerequisites for use of a parametric test were not fulfilled. For these analyses species densities were summed in each of the habitat preference class before pairwise comparison. Because the statistical tests were not independent between the comparisons, significant differences were based on sequential Bonferroni correction (
Next, in a combined analysis, habitat preference class and distribution pattern were compared through repeated measures analysis of variance (ANOVA). Time (periods) represents here a quantitative, repeated factor, the effects of which can be examined via within-subject contrasts (e.g., Gurevitch and Chester 1986;
Change in the average density of each habitat preference group was compared in each of the protected area between the two time slices (n = 96). Percentage changes in density in each of the protected areas were used. Percentage changes above and below 100% are not strictly comparable; for example, a doubling increase from 100 gives a value of 200, but a similar decrease to half that yields 50. To avoid this discrepancy, we used logarithmic ratio (log ratio) of per cent change in densities, where, for example, 100% increase in density from 1981–1999 to 2000–2009 would be log (200/100) = +0.301 and 50% decrease is log (50/100) = –0.301. In a linear regression analysis we used location (south-north) and size of a protected area (log-transformed) as predictive (explanatory) variables for the temporal density changes of the different bird groups. South-north location and size of protected area are positively correlated (r = 0.629, p<0.001) i.e. largest protected areas are situated in the northernmost Finland.
Densities of bird species between the two time periods were compared also based on IUCN threat categories in Finland (
The mean temperature of the coldest month (February) and that of April–June essential for bird species (see
Population changes of species groups based on habitat preferences in 1981–1999 and in 2000–2009 are presented in Table 1. The mean density of forest habitat generalists did not change from 1981–1999 to 2000–2009. Forest habitat generalists accounted for more than half of all breeding bird pairs (55–56%) in protected areas. Densities of species of coniferous forests and species preferring old-growth and mature forests increased, while species of deciduous forests and bushes, species of mires and wetlands, and species of Arctic mountains decreased between the two time slices (see Table 1). In proportional terms, the largest decrease was in species of Arctic mountains, which declined to less than half (–57%), and the largest increase in species preferring old-growth and mature forests, which increased by 29%.
Mean densities (pairs/km2 ± standard error) of bird species groups with different habitat preferences in 1981–1999 and in 2000–2009. Statistical test (N = 96) by paired t-test or Wilcoxon signed rank test (species of Arctic mountains). Number of species in each species group in parentheses.
| Species group | 1981–1999 | 2000–2009 | t | z | pa | Ranksb |
|---|---|---|---|---|---|---|
| Forest habitat generalists (15) | 63.15±3.66 | 60.38±3.02 | 1.170 | – | 0.245 | – |
| Species of coniferous forests (26) | 17.75±1.42 | 20.65±1.49 | 4.079 | – | <0.001 | – |
| Species preferring old-growth or mature forests (14) | 2.83±0.21 | 3.64±0.27 | 3.848 | – | <0.001 | – |
| Species preferring deciduous forests and bushes (23) | 3.27±0.67 | 2.49±0.52 | 2.633 | – | 0.010 | – |
| Species of mires and wetlands (36) | 22.41±2.47 | 18.65±2.04 | 3.210 | – | 0.002 | – |
| Species of cultivated areas (23) | 2.27±0.24 | 2.88±0.34 | 2.083 | – | 0.040 | – |
| Species of Arctic mountains (11) | 0.37±0.15 | 0.16±0.07 | – | 2.561 | 0.010 | 7/23/66 |
a Significant differences (bold) are based on sequential Bonferroni correction.<br/> bRanks between 2000–2009 and 1981–1999: positive/negative/tied.
Densities of southern species increased significantly in forests habitat generalists, in species of coniferous forests and in species preferring old-growth or mature forests from 1981–1999 to 2000–2009 (Table 2). Densities of northern species decreased significantly in forest habitat generalists, in species of coniferous forests and in species of mires and wetlands. Species of coniferous forests distributed across the whole country increased (Table 2).
Densities of species groups with different habitat preferences (p/km2 ± s. e.) according to distribution pattern. Statistical significance is based on paired t-test (df = 95) or Wilcoxon signed rank test (N=96). Number of species in each group in parentheses. All Arctic mountain species are northern (see Table 1) and no species of cultivated areas is northern.
| Distribution pattern | 1981–1999 | 2000–2009 | t | z | pa | Ranksb |
|---|---|---|---|---|---|---|
| Forest habitat generalists | ||||||
| Southern species (5) | 13.76±1.96 | 18.19±2.11 | 4.686 | – | <0.001 | – |
| Northern species (2) | 12.93±0.93 | 10.06±0.82 | 3.924 | – | <0.001 | – |
| Whole countryc (8) | 36.46±2.12 | 32.13±1.59 | 2.611 | – | 0.010 | – |
| Species of coniferous forests | ||||||
| Southern species (16) | 11.61±1.23 | 14.34±1.36 | 4.915 | – | <0.001 | – |
| Northern species (6) | 2.41±0.22 | 1.63±0.18 | 4.569 | – | <0.001 | – |
| Whole country (4) | 3.74±0.24 | 4.68±0.29 | 4.068 | – | <0.001 | – |
| Species preferring old-growth or mature forests | ||||||
| Southern species (6) | 1.08±0.14 | 1.68±0.19 | 5.385 | – | <0.001 | – |
| Northern species (6) | 0.99±0.12 | 1.08±0.12 | 0.770 | – | 0.443 | – |
| Whole country (2) | 0.76±0.07 | 0.88±0.08 | 1.182 | – | 0.240 | – |
| Species preferring deciduous forests and bushes | ||||||
| Southern species (20) | 2.70±0.66 | 2.06±0.52 | 2.386 | – | 0.019 | – |
| Northern species (2) | 0.56±0.20 | 0.42±0.13 | – | 1.304 | 0.192 | 21/15/60 |
| Whole country (1) | 0.01±0.00 | 0.01±0.01 | – | 0.350 | 0.727 | 6/7/83 |
| Species of mires and wetlands | ||||||
| Southern species (8) | 0.02±0.01 | 0.02±0.01 | – | 0.751 | 0.452 | 14/16/66 |
| Northern species (22) | 19.08±2.26 | 15.63±1.86 | 3.248 | – | 0.002 | – |
| Whole country (6) | 3.30±0.62 | 2.99±0.60 | 1.184 | – | 0.239 | – |
| Species of cultivated areas | ||||||
| Southern species (15) | 0.52±0.09 | 0.65±0.12 | 1.658 | – | 0.101 | – |
| Whole country (8) | 1.75±0.19 | 2.23±0.26 | 1.971 | – | 0.052 | – |
a Significant differences in bold (sequential Bonferroni correction for all the comparisons).<br/> bRanks between 2000–2009 and 1981–1999: positive/negative/tied.<br/> cWhole country = species distributed throughout the country.
In the repeated measures ANOVA carried out for the most common 37 species, there was a significant difference both in the habitat preference and in the distribution pattern (Table 3). However, the statistical significance for the distribution pattern (F = 38.16, p < 0.001) was much more pronounced than for the habitat preference (F = 3.06, p = 0.016; Table 3). Northern species decreased and southern species increased in the different habitat preference classes (Fig. 2). Interaction between factor levels and the two between-subject factors (habitat preference and distribution pattern) was significant (F = 9.631, p < 0.001), which was mainly due to the fact that species distributed across whole country included both increased and decreased species (see Fig. 2).
Results of within-subject contrasts of repeated measures analysis of variance (ANOVA). Factor levels (within-subject): density in 1981–1999 and 2000–2009; between-subjects factors: habitat preference (habitat), distribution pattern. * = Interaction between factor levels and different between-subjects factors.
| Source | adf | bMS | F | p |
|---|---|---|---|---|
| Factor | 1 | 27.331 | 6.030 | 0.014 |
| Factor*species | 1 | 5.548 | 1.224 | 0.269 |
| Factor*protected areas | 1 | 20.926 | 4.617 | 0.032 |
| Factor*habitat | 2 | 13.878 | 3.062 | 0.016 |
| Factor*distribution | 2 | 172.970 | 38.161 | <0.001 |
| Factor*habitat *distribution | 3 | 43.654 | 9.631 | <0.001 |
| Error (factor) | 3539 | 4.533 |
adf = degrees of freedom.
bMS = mean squre.
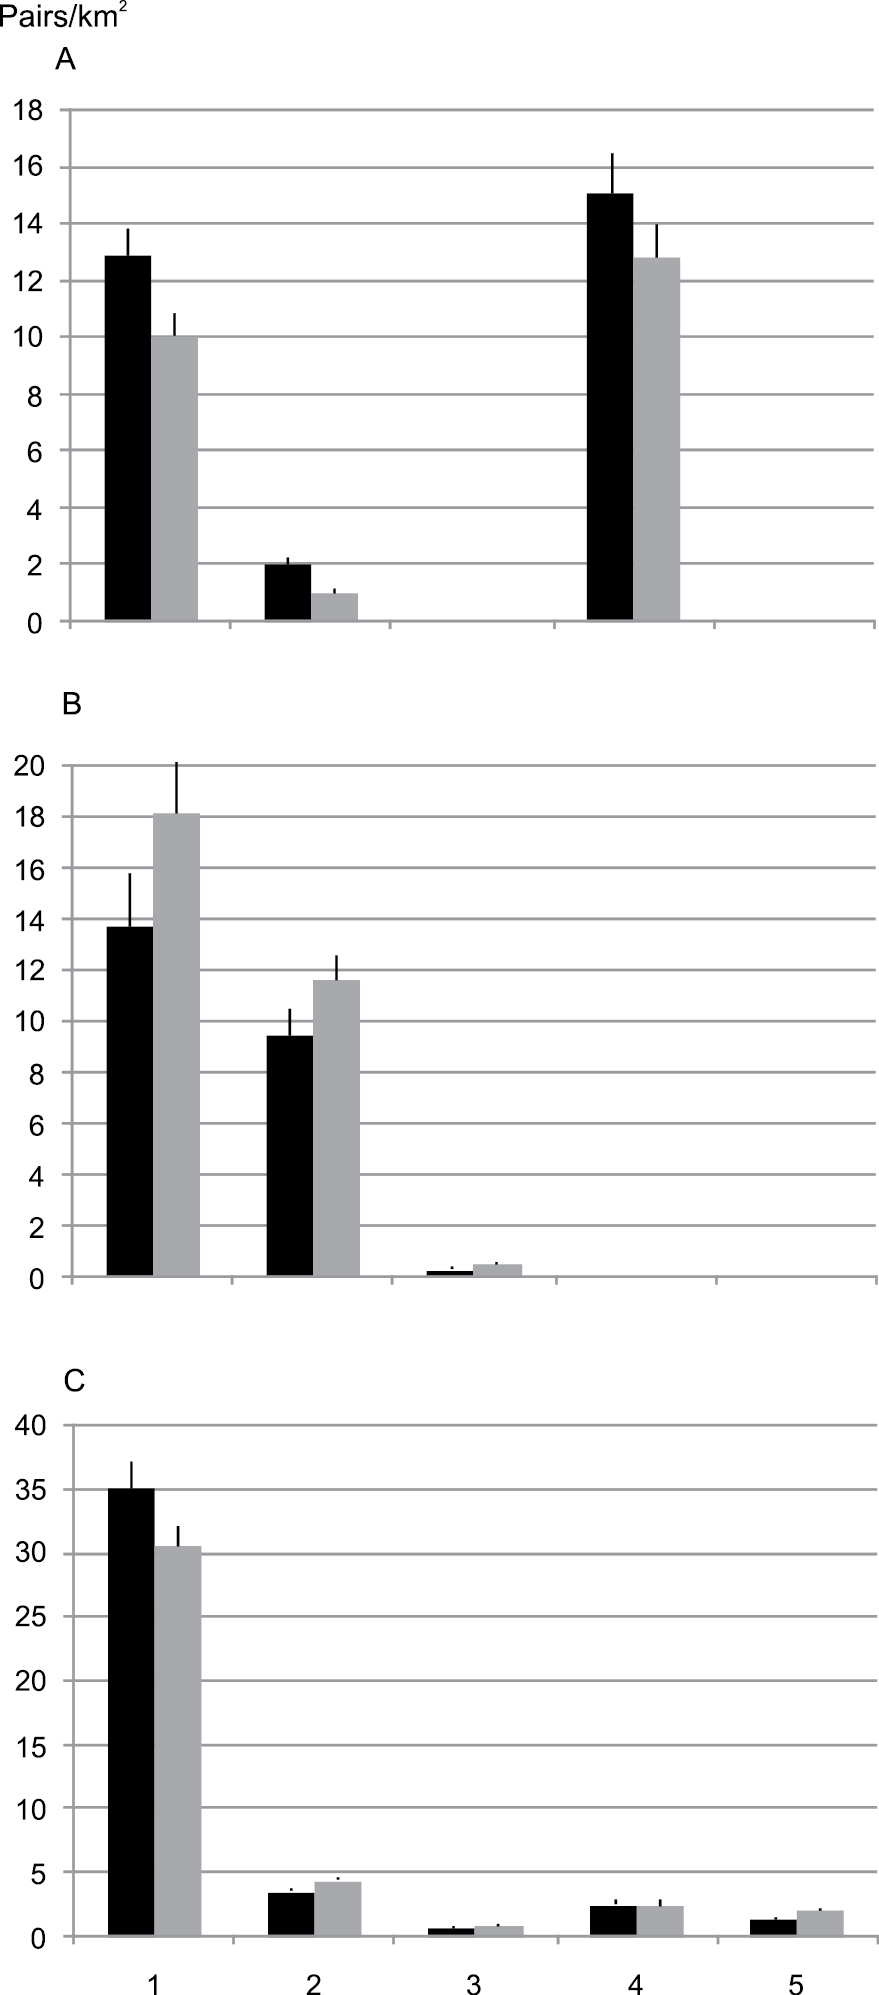
Mean density (pairs/km2±S.E.) of different bird species groups (most common species) in protected areas in 1981–1999 (black columns) and in 2000–2009 (gray columns). 1 = forest habitat generalists, 2 = species of coniferous forests, 3 = species preferring old-growth or mature forests, 4 = species of mires and wetlands, 5 = species of cultivated areas. A northern species B southern species C species distributed over the whole country. Northern species preferring old-growth forests, southern species of mires and wetlands, and both southern and northern species of cultivated areas were not included in the analysis due to their rarity or absence.
The regression model with south-north location and size of protected area as predictive variables explained significantly only population changes of species of coniferous forests, and this species group increased most in the northern Finnish protected areas (Table 4, Fig. 3A). In other species groups location and size of protected area did not affect population changes observed (for species of mires and wetlands, see Fig. 3B).
Regression analyses based on location (south-north coordinates) and size of a protected area (log-transformed) as predictors affecting the temporal density changes of species groups with different habitat preferences. dfregression = 2, dfresidual = 93. The values (B) and significance (based on t-test) of the standardized coefficients are presented. Standardization of the coefficient shows which of the independent variables have a greater effect on the dependent variable, when the variables are originally measured in different units (see Quinn and Keough 1982).
| Species group | ar2 | bMS | F | p | Standardized coefficients | |||||
|---|---|---|---|---|---|---|---|---|---|---|
| Location | Size | |||||||||
| B | t | p | B | t | p | |||||
| Forest habitat gene-ralists | 0.044 | 0.069 | 2.145 | 0.123 | 0.254 | 1.944 | 0.055 | –0.087 | 0.668 | 0.506 |
| Species of coniferous forests | 0.154 | 0.499 | 8.480 | <0.001 | 0.365 | 2.976 | 0.004 | 0.042 | 0.340 | 0.735 |
| Species preferring old-growth or mature forests | 0.017 | 0.145 | 0.800 | 0.452 | –0.137 | 1.039 | 0.302 | 0.012 | 0.093 | 0.926 |
| Species preferring deciduous forests and bushes | 0.004 | 0.092 | 0.165 | 0.848 | 0.060 | 0.451 | 0.653 | -0.075 | 0.560 | 0.577 |
| Species of mires and wetlands | 0.015 | 0.064 | 0.685 | 0.507 | –0.117 | 0.882 | 0.380 | –0.006 | 0.043 | 0.966 |
| Species of cultivated areas | 0.013 | 0.113 | 0.628 | 0.536 | –0.110 | 0.831 | 0.408 | –0.008 | 0.062 | 0.951 |
ar2 = coefficient of determination
bMS = mean square
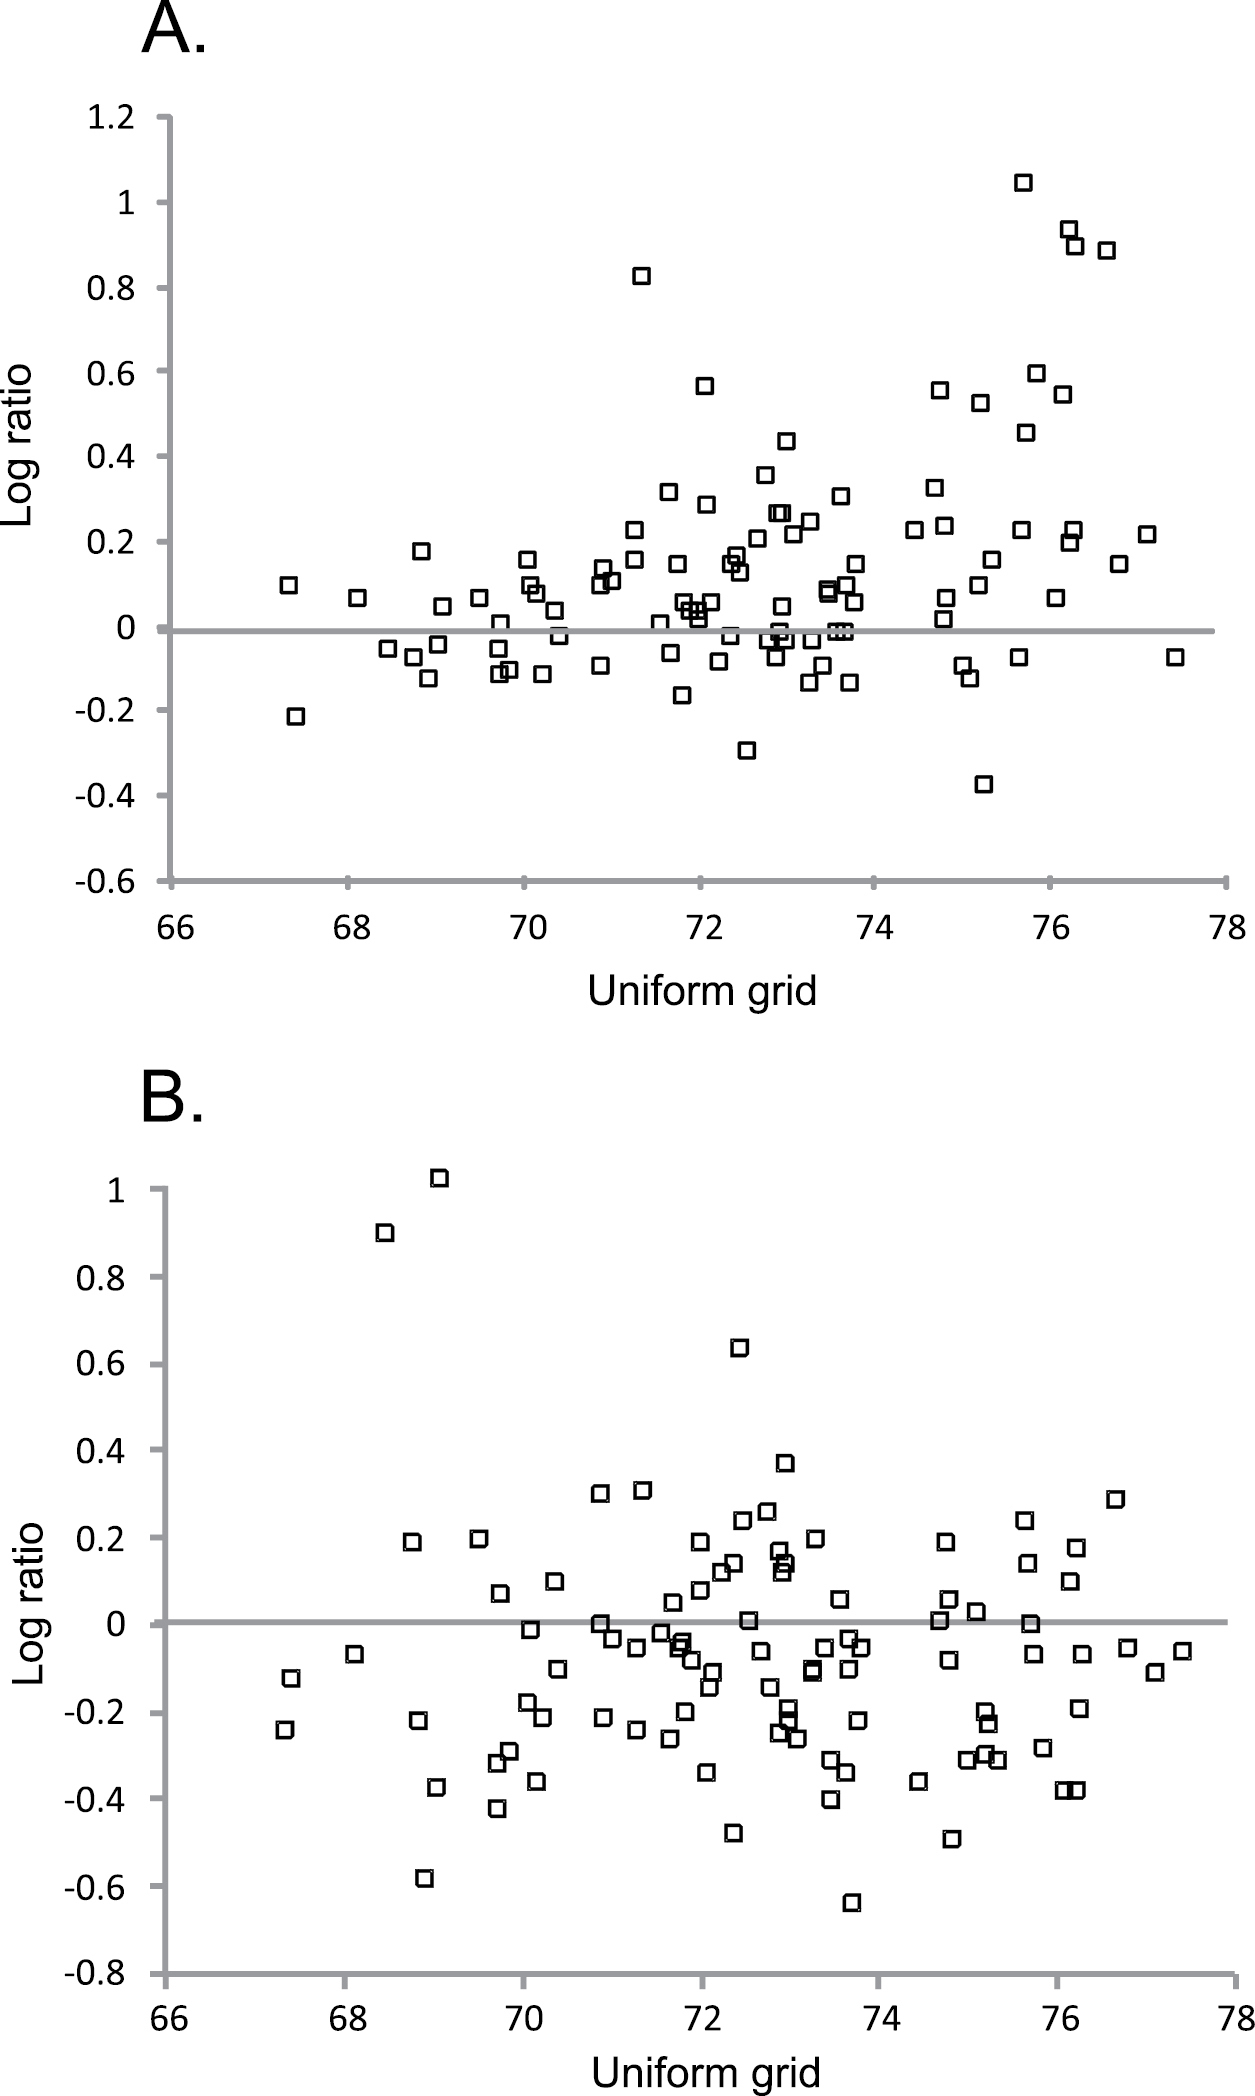
Change in the average density of species of coniferous forests (A.) and species of mires and wetlands (B.) from 1981–1999 to 2000–2009, based on log ratio [log ratio = log (density in 2000–2009/density in 1981–1999)] in each protected area (n = 96) according to location from south to north (for uniform grid, see Figure 1). Values of log ratio above zero (line) show population increase and those below zero population decline in each protected area.<br/>
Densities of both threatened and near threatened bird species decreased significantly from 1981–1999 to 2000–2009, while density of the other species (least concern) did not change between the two time periods (Table 5).
Densities (pairs/km2 ± s.e.) of bird species groups according to IUCN threat status (threatened, near-threatened, least concern, see Appendix) in Finland in 1981–1999 and in 2000–2009. Statistical test (df = 95) by paired t-test. Number of species in each species group in parentheses.
| IUCN category | 1981–1999 | 2000–2009 | t | p |
|---|---|---|---|---|
| Threatened (23) | 8.53±0.67 | 5.63±0.50 | 6.142 | <0.001 |
| Near threatened (19) | 10.18±0.81 | 8.25±0.66 | 3.714 | <0.001 |
| Least concern (106) | 93.35±5.16 | 94.97±4.64 | 0.510 | 0.611 |
We observed that patterns in the population changes of the different bird species groups varied considerably. Moreover, there were large within-species-group differences in population trends when distribution pattern of species was taken into account. At a European scale
The species of greatest conservation interest in terms of land-use pressures showed interesting patterns: species preferring old-growth or mature forests have contrasting trends with the species of mires and wetlands in the protected area network. Preserving old-growth forests seem to have clearly benefited species preferring these habitats in Finland, while species of mires and wetlands have decreased in spite of fairly large-scale protection of these habitats. However, an important point here is that a much larger proportion of bird pairs in species preferring old-growth forests are southern (38–46%) than the equivalent figure among species of mires and wetlands (0.1%). There was a general pattern in the different species groups that northern species had decreased and southern species had increased, which is in line with the predictions of range shifts of species both in Europe and in Fennoscandia (
Also species of Arctic mountains have decreased, although about 90% of mountain heaths are within protected areas (
Moreover, species of mires and wetlands have decreased also in large protected areas situated in northernmost Finland (see Fig. 3B), in which region (north of the uniform grid 74 in Fig. 1) mires have not been ditched at all (
In a recent study,
Forest habitat generalists had not increased, in contrast with the other species group in which species have large habitat amplitudes – namely, species of coniferous forests. These species occur in variable coniferous woods without strict habitat preferences. As in the comparison of species groups of greatest conservation interest (species preferring old-growth forests vs. species of mires and wetlands), a much larger proportion of species and bird pairs of coniferous forests are southern (about 55%) than among forest habitat generalists (20–30%, see Table 2), which probably explains the different patterns of population changes in these species groups. The increase of species of coniferous forests was most pronounced in the northernmost protected areas (Fig. 3A). This probably reflects the fact that southern bird species have increased most at their northern range boundary occurring in northernmost Finland (
The decrease of species of deciduous forests and bushes may be caused by the fact that many of these species occur in early succession forest habitats which have changed as a consequence of forest succession in many of the studied protected areas during the study period. Many bird species prefer early succession forest habitats and disappear or decline, when forest maturates (see
Forest succession probably also affects the increase of southern old-growth forest species, because in southern Finland many forests in protected areas have previously been managed and therefore forests are much younger there than in northern Finnish protected areas (
Bird species populations in protected areas have thus been affected by climate change, successional habitat changes in protected areas and probably also landscape-level habitat changes outside protected areas. The latter two factors cannot however explain the general, overall increase of southern species and decrease of northern species (Tables 2 and 3 and Fig. 2). Moreover, two-thirds of the threatened species in our data (15/23) are northern.
There might be a relation between climate niche, habitat niche and range size affecting population trends of species. Barnaugaud et al. (2012) observed in studying climate and habitat niches of French birds that species with narrow thermal breadths were also more often habitat specialists. We did not study climate niches of bird species but in general southern species probably have larger ranges and also larger climate niches than northern species. So there may be a positive correlation between climate niche and population trend, but this issue should be properly studied.
Specialist species might be more susceptible to climate change than habitat generalists (
Densities of northern species have generally declined (
In a recent work dealing with protected area networks in Canada, it was observed that butterfly populations had declined both in protected and in non-protected areas, suggesting that existing reserve networks have provided little buffer against the impacts of climate change on butterfly species richness (
Mires and mountain heaths change more rapidly in consequence of climate warming than old-growth forests, for which reason populations on mires and mountain heaths are also more affected by climate change. For example, in northernmost Europe, wet, structurally diverse palsa mires created by permafrost are expected to decline and become more homogeneous fairly rapidly in the coming decades as a consequence of climate warming (
In conclusion, the protected area network is highly dependent on the susceptibility of focal habitats to climate change effects. If the focal habitats are expected to change rapidly because of climate change (as with mires and heaths), the protected area network appears more vulnerable in preserving species in the focal habitats than if the time lag in the effects of climate change on habitat is presumed to be long (as with old-growth forests).
The large bird census data sets were collected by numerous field ornithologists, whom we gratefully acknowledge. Most of the census data have been collected in Natural Heritage Services of Metsähallitus (the Finnish Forest and Park Service). The work was part of the A-LA-CARTE –project (RV) in the Academy of Finland’s Research Programme on Climate Change (FICCA). The comments by two anonymous reviewers are greatly acknowledged.
Bird species' census data in Finnish protected areas (doi: 10.3897/natureconservation.3.3635.app). File format: MS Word Document (doc).
Explanation note: Mean densities and number of observations of species in 1981–1999 and in 2000–2009.