


(C) 2013 Cindy L. Bongard. This is an open access article distributed under the terms of the Creative Commons Attribution License 3.0 (CC-BY), which permits unrestricted use, distribution, and reproduction in any medium, provided the original author and source are credited.
For reference, use of the paginated PDF or printed version of this article is recommended.
Fungal communities forming associations with plant roots have generally been described as ranging from symbiotic to parasitic. Disruptions to these associations consequently can have significant impacts on native plant communities. We examined how invasion by Vincetoxicum rossicum, a plant native to Europe, can alter both the arbuscular mycorrhizal fungi, as well as the general fungal communities associating with native plant roots in both field and woodland sites in Southern Ontario. In two different sites in the Greater Toronto Area, we took advantage of invasion by Vincetoxicum rossicum and neighbouring uninvaded sites to investigate the fungal communities associating with local plant roots, including goldenrod (Solidago spp.), wild red raspberry (Rubus idaeus), Canada anemone (Anemone canadensis), meadow rue (Thalictrum dioicum), and wild ginger (Asarum canadense). Fungi colonizing roots were characterized with terminal restriction fragment length polymorphism (T-RFLP) analysis of amplified total fungal (TF) and arbuscular mycorrhizal fungal (AMF) ribosomal fragments. We saw a significant effect of the presence of this invader on the diversity of TF phylotypes colonizing native plant roots, and a composition shift of both the TF and AMF community in native roots in both sites. In native communities invaded by Vincetoxicum rossicum, a significant increase in richness and colonization density of TF suggests that invaders such as Vincetoxicum rossicum may be able to influence the composition of soil fungi available to natives, possibly via mechanisms such as increased carbon provision or antibiosis attributable to unique root exudates.
Plant invasions, Vincetoxicum rossicum, arbuscular mycorrhizal fungi (AMF), molecular identification, diversity, T-RFLP
Plant invasions have resulted in observable shifts in the above ground plant communities, and there is evidence that soil fungi are also being significantly altered as the invasion process progresses (
AMF species richness has been shown to affect plant productivity, and observed shifts in plant-AMF associations could impact plant community structure (
We compared both total fungal (TF) and AMF associations of the non-native vine Vincetoxicum rossicum or dog-strangling vine (DSV), several field and woodland native plants growing in dense patches of DSV, and the same natives growing separately from DSV. DSV is widely distributed in Eastern North America and has established virtual monocultures, consequently reducing diversity in local native ecosystems (
In this study, we investigated the fungal communities associating with the roots of DSV and native plants in two proximal watersheds where dramatic invasions of DSV have occurred, taking advantage of the natural invasion of DSV into native field and woodland areas. We hypothesized that fungal root colonizers of native plants growing within dense patches of DSV would increase significantly in both richness and density relative to those growing separately from DSV. These findings are novel with respect to the use of molecular techniques to characterize the fungal community associating with DSV and natives persisting in DSV patches. The alternative, more traditional methods, including soil spore analysis or root-piece microscopy, are not able to produce similarly reliable and replicable results.
Root samples of DSV and co-occurring native plant species were collected from field and woodland plots in two main sites that are in permanent neighbouring watersheds in Southern Ontario: East Highland Creek at the University of Toronto at Scarborough (UTSC: 43.7803°N, 79.1886°W), and the Rouge River at the Toronto Zoo (Zoo: 43.8208°N, 79.1852°W). Both sites provide access to DSV patches that are well established, as well as occurrences of plants in both field and woodland areas; site details are shown in Table 1. Within a given plot, three replicates of DSV or each native plant commonly co-occurring with DSV were taken from field and woodland areas in spring and fall; the distance between individual plant samples collected ranged from approximately 1–4 m. Plot selections were based on sufficient representation by DSV in field and woodland environments (densely populated areas), a distance of at least 5 m away from field or woodland edge, and representation by field and woodland natives in i) the absence of DSV (visually) as well as ii) the presence of densely populated patches of DSV. Collections were made from eight Zoo plots and eight UTSC plots: n = 2 DSV plots per site, n = 3 natives growing separately from DSV (‘natives’) plots per site, and n = 3 natives growing in dense DSV patches (‘natives-in-dsv’) plots per site. A cumulative total of 36 samples per site (18 field and 18 woodland) were collected from the plots in May and October 2009, or 72 samples available for analyses (Table 2). Soil samples from two invaded and two uninvaded plots per site were sent to the University of Guelph Laboratory Services Division (Guelph, Ontario) for analysis, including both field and woodland samples. Soil sampling depth was approximately 15–20 cm. Details of the soil analysis are listed in Table 3.
Site locations, prevailing plants, and soil descriptions for plots in study sites.
| Site (Including field and woodland plots) |
Coordinates/ location |
Soil | Well-represented native/naturalized plants |
|---|---|---|---|
| Highland Creek Ravine at UTSC Campus | 43.7803°N, 79.1886°W (Morningside Ave. and Ellesmere Rd., Toronto) | Mostly Sandy-silts, sands, clays (http://www.trca.on.ca/dotAsset/37550.pdf) |
Staghorn sumac (Rhus typhina), solomon’s seal (Polygonatum pubescens), goldenrod (Solidago spp.), poison ivy (Rhus radicans), grasses, white + purple aster (Symphyotrichum spp.), queen Anne’s lace (Daucus carota), vetch (Vicia cracca), riverbank grape (Vitis riparia), dandelion (Taraxacum spp.), yellow goatsbeard (Tragopogon dubius), sweet white clover (Melilotus alba), chicory (Cichorium intyb us), mullein (Verbascum thapsus), jewelweed (Impatiens capensis), phlox (Phlox spp.), avens (Geum aleppicum), lopseed (Phryma leptostachya), bedstraw (Galium mollugo), red raspberry (Rubus idaeus) |
| Toronto Zoo (near Rouge River) |
43.8208°N, 79.1852°W (Meadowvale Rd. and Old finch Rd., Toronto) | Sandy loam, silty clay (http://www.trca.on.ca) | Meadow rue (Thalictrum dioicum), dandelion (Taraxacum spp.), goldenrod (Solidago spp.), grasses, vetch (Vicia cracca), milkweed (Asclepias syriaca), staghorn sumac (Rhus typhina), wild ginger (Asarum canadensis), bloodroot (Sanguinaria Canadensis), dutchman’s breeches (Dicentra cucullaria), wild leek (Allium tricoccum), baneberry (Actaea rubra) and (Actaea pachypoda), may apple (Podophyllum peltatum), aster (Aster spp.), queen Anne’s lace (Daucus carota), cinquefoil (Potentilla simplex), dames rocket (Hesperis matronalis), jewelweed (Impatiens capensis), sweet white clover (Melilotus alba), dogbane (Apocynum androsaemifolium) |
Plant collections from 2 sites: UTSC and ZOO. Natives growing in DSV patches denoted by ‘-dsv’ post script.
| Site | Environment | Native plant species | Fall (October) |
Plot | Spring (May) |
Plot |
|---|---|---|---|---|---|---|
| UTSC 43.7803°N, 79.1886°W |
Field Woodland |
Solidago spp. | 3 goldenrod 3 goldenrod-dsv 3 DSV |
U1 U2 U3 |
3 goldenrod 3 goldenrod-dsv 3 DSV |
U1 U2 U3 |
| Rubus idaeus Anemone canadensis |
3 raspberry 3 raspberry-dsv 3 DSV |
U4 U5 U6 |
3 anemone 3 anemone-dsv 3 DSV |
U7 U8 U6 |
||
| ZOO 43.8208°N, 79.1852°W |
Field Woodland |
Solidago spp. | 3 goldenrod 3 golderod-dsv 3 DSV |
Z1 Z2 Z3 |
3 goldenrod 3 goldenrod-dsv 3 DSV |
Z1 Z2 Z3 |
| Asarum canadense Thalictrum dioicum |
3 wild ginger 3 wild ginger-dsv 3 DSV |
Z4 Z5 Z6 |
3 meadow rue 3 meadow rue-dsv 3 DSV |
Z7 Z8 Z6 |
University of Guelph Soil analysis report shows P, K, and Mg levels for four samples collected from each of the two main study sites. F = field, W = woodland, Z = Zoo, U = UTSC, -dsv = grown in DSV, -no = no/little DSV present; t-test shows comparisons between all DSV and non-DSV samples for each soil component analyzed (i.e. samples 1-4 and 5-8); *significant results.
| Sample/ | Moist | NH4 | NO3 | Tot carb | Inorg Carb | Org Carb | P | Mg | K | pH |
|---|---|---|---|---|---|---|---|---|---|---|
| Env-Site | % dry | mg/ kg | mg/ kg | % dry | % dry | % dry | mg/ L | mg/ L | mg/ L | |
| 1 FZ-dsv | 17.57 | 1.95 | 0.49 | 3.83 | 2.46 | 1.37 | 4 | 100 | 57 | 7.9 |
| 2 FU-dsv | 23.74 | 0.94 | 0.49 | 3.12 | 1.72 | 1.4 | 3.3 | 75 | 78 | 7.9 |
| 3 WZ-dsv | 24.34 | 1.72 | 1.22 | 6.25 | 3.74 | 2.51 | 14 | 140 | 170 | 7.7 |
| 4 WU-dsv | 27.72 | 1.49 | 5.94 | 5.03 | 1.05 | 3.98 | 9.4 | 88 | 44 | 7.7 |
| Ave | 23.3 | 1.5 | 2.0 | 4.6 | 2.2 | 2.3 | 7.7 | 100.8 | 87.3 | 7.8 |
| 5 FZ-no | 26.52 | 1.79 | 4.28 | 2.56 | 0.25 | 2.31 | 13 | 56 | 120 | 7.7 |
| 6 FU-no | 29.37 | 1.25 | 4.31 | 3.47 | 1.85 | 1.62 | 2.9 | 52 | 20 | 7.9 |
| 7 WZ-no | 34.84 | 1.54 | 0.97 | 3.98 | 0 | 3.98 | 5.5 | 100 | 45 | 6.6 |
| 8 WU-no | 40.49 | 2.34 | 3.8 | 5.14 | 0.08 | 5.06 | 3.8 | 290 | 120 | 6.9 |
| Ave | 32.8 | 1.7 | 3.3 | 3.8 | 0.5 | 3.2 | 6.3 | 124.5 | 76.3 | 7.3 |
| t-test p-value | 0.02* | 0.27 | 0.22 | 0.21 | 0.03* | 0.19 | 0.35 | 0.35 | 0.39 | 0.07 |
The plants were dug up carefully to protect root hairs and to ensure that the entire root ball was extracted from the ground. Samples were transported to the lab within a few hours of collection, where they were stored at 4°C until processing the following day. The roots were then washed extensively in distilled water, and then root sections were removed for subsequent DNA extractions. Only fine roots attached to the plant were used.
FastDNA® SPIN Kit (Q-Biogene, Carlsbad California) was used for all DNA extractions. Genomic DNA was extracted from approximately 200 mg of root tissue in accordance with the manufacturer’s protocols, using a fungal specific lysis buffer included in the kit (CLS-Y). After extraction, total DNA concentrations from all samples were estimated spectrophotometrically using the NanoDrop™ ND-1000 V3.7.0 (Thermo Fisher Scientific Inc., Wilmington, USA), and visualized by gel electrophoresis on a 0.8% (wt/vol) agarose gel containing ethidium bromide in 0.5× Tris/Borate/EDTA buffer and quantified using a DNA ladder (GeneRuler™ 1kb DNA Ladder Plus, Fermentas, Burlington, Ontario); gels were run at 100 V for 0.5 hour intervals until distinct bands were resolved. The average yield of DNA was 6.5 mg of DNA per root sample.
Primers designed to specifically amplify fungal sequences from the inter-transcribed spacer (ITS) region of the ribosomal operon (ITS1F 5'-CTT GGT CAT TTA GAG GAA GTA A-3' forward and ITS4 5'-TCC TCC GCT TAT TGA TAT GC-3' reverse) were used for detecting general fungal colonizers as they were putatively more selective for fungal DNA than the alternative ITS1-ITS4 primer pair (
The small subunit (SSU) primers AML1 and AML2 (AML1 5'-ATC AAC TTT CGA TGG TAG GAT AGA-3' forward and AML2 5'-GAA CCC AAA CAC TTT GGT TTC C-3' reverse) designed by
All primers were labeled with fluorescent dyes phosphoramidite 6-FAM and HEX (forward and reverse label respectively, labeled at the 5’ end; Invitrogen Canada) and PCR products were visualized using a 1.0% (wt/vol) agarose gel, as above. 10 µl of each restricted sample was analyzed on a 3730 DNA sequencer (Applied Biosystems Inc., Fredmont, California) for sizes and intensities (peak height) of the 5’-terminal fragment at the Laboratory Services Division at the University of Guelph (Guelph, Ontario). T-RFLP data were displayed graphically as individual fluorescence peaks that represent individual phylotypes. Fragment sizes ranged from 50–900 base pairs (bp) and included a range of fluorescence intensities. Replicate, independent PCRs and endonuclease restrictions, as well as T-RFLP analysis were tested for several samples, which confirmed reproducibility. The total number of TRFs is treated as an estimate of the fungal community complexity or diversity.
To analyze amplified PCR products from both ITS and AML primers, selected amplicons were cloned with TOPO TA Cloning® Kit for Sequencing (Invitrogen, United States) according to manufacturer’s protocols. pCR®4-TOPO® plasmids were added to a mixture of PCR products, dilute salt solution and RNase free water at room temperature. Ligated plasmids were transformed into chemically competent One Shot® TOP10 or Mach-1™ – T1R Escherichia coli cells. Transformed cells were selected on kanamycin [50 ng/µl] containing LB plates. Single colonies were transferred to liquid culture medium containing selective agent kanamycin [50 ng/µl] and grown for plasmid extraction using QIAprep® Miniprep kit (Qiagen, Canada). Genomic DNA, proteins and cellular debris were precipitated and removed by centrifugation. Plasmids were captured by QIAprep spin column and eluted using Tris-based buffer. PCR amplification (using ITS1F-ITS4 and AML1-AML2 primer pairs) or restriction enzyme digestion with Eco RI was carried out to verify the presence of inserted amplicons. Plasmids containing inserts of interest were sequenced using M13 (-27) reverse primer by The Center for Applied Genomics (SickKids Hospital, Canada).
Clone sequences were analyzed using nucleotide BLAST program from NCBI (http://blast.ncbi.nlm.nih.gov/). The AML1-AML2 primer pair showed high AMF specificity, amplifying only species belonging to the Glomus or Paraglomus genus (phylum of Glomeromycota) from all plant samples.
Peak height data for each individual TRF or phylotype were normalized to a percentage of total fluorescence per sample to account for the differences in the amount of amplicon sent for analysis. The normalized terminal restriction fragment data were then aligned using a macro created by Christopher Walsh (
NMDS (based on Bray-Curtis distances) and Adonis (non-parametric permutation MANOVA or analysis of difference in R, based on 99 permutations; analogous to redundancy analysis,
To determine significant TRFs contributing to the different analyses, principal component analysis (PCA) was performed in R to reduce the TRF data dimensionality prior to performing discriminant analysis (DA); principal components with eigenvalues > 1 were used in the DA. Significant loadings (TRFs) from the principal components were used in the DA to produce graphs of sample cluster patterns based on the variables that best discriminated among the different defined groups. Differences in fungal phylotype density and richness levels between samples were tested using Student’s t-tests or ANOVA.
TF amplicons of approximately 700–900 bp and AMF amplicons of 500–800 bp were successfully obtained from root tip DNA. TRFs were successfully obtained from the samples using both FAM- and HEX-labeled primers and both sets of restriction enzymes. Replicate T-RFLP analyses for both TF and AMF produced highly similar results with regard to both TRF phylotypes and peak heights. Based on sequencing results, all TF sequences were fungal, and all AMF sequences were Glomeromycota.
The community composition of the TF and AMF communities for DSV, natives-in-dsv, and natives was investigated using multivariate analyses of the normalized FAM and HEX TRF data. Given the tendency of the data to sort significantly by season in initial analyses (data not shown), all data were grouped by season (spring or fall) for subsequent fungal community comparisons.
TF phylotypes showed a tendency to sort by site initially and to a lesser extent environment when woodland and field samples were analyzed collectively. However, once the data were parsed into field and woodland sets, site was no longer a significant factor in either the spring or fall data analyses. Sample type remained significant throughout the analyses, with FAM and HEX data showing similar results, indicating where TF community patterns were strongly affected by the presence of DSV. Ordination results for spring and fall TF sample sets are shown in Table 4. The NMDS stress values for all analyses are < 0.20, indicating that the ordination results for the data sets are biologically relevant (
Multivariate results comparing DSV, natives-in-dsv, and natives TF and AMF sample sets where data are included from 2 sites + 2 environments (env) (field versus woodland) and subsequently reduced to only woodland environment; results from both FAM- and HEX-labeled primers are shown.
| All fall samples | Fall wood only (FAM) | Fall wood only (HEX) | All spring samples | Spring wood only (FAM) | Spring wood only (HEX) | |||||||
|---|---|---|---|---|---|---|---|---|---|---|---|---|
| TF | AMF | TF | AMF | TF | AMF | TF | AMF | TF | AMF | TF | AMF | |
| NMDS Stress | 0.19 | 0.15 | 0.12 | 0.006 | 0.15 | 0.001 | 0.19 | 0.12 | 0.15 | 0.12 | 0.19 | 0.10 |
| Adonis R2 (type) | 0.16 | 0.24 | 0.24 | 0.38 | 0.12 | 0.17 | 0.07 | 0.25 | 0.13 | 0.30 | 0.16 | 0.25 |
| Adonis R2 (plant) | 0.26 | 0.28 | 0.33 | 0.29 | 0.25 | 0.38 | 0.27 | 0.06 | 0.30 | 0.10 | 0.22 | 0.31 |
| Adonis p-value (site) | 0.01 | 0.19 | 0.12 | 0.97 | 0.06 | 1.0 | 0.01 | 0.06 | 0.82 | 0.72 | 0.11 | 0.97 |
| Adonis p-value (env) | 0.04 | 0.86 | n/a | n/a | n/a | n/a | 0.05 | 0.86 | n/a | n/a | n/a | n/a |
| Adonis p-value (type) | 0.01 | 0.01 | 0.01 | 0.01 | 0.01 | 0.03 | 0.01 | 0.01 | 0.01 | 0.03 | 0.01 | 0.05 |
| Adonis p-value (plant) | 0.01 | 0.01 | 0.01 | 0.02 | 0.01 | 0.07 | 0.01 | 0.81 | 0.01 | 0.96 | 0.01 | 0.14 |
For the AMF data, site was not a significant factor affecting sample type group association, even prior to taking environment into consideration for either the spring or fall data. Sample type remained significant throughout the analyses, indicating where DSV, natives-in-dsv, and natives support different AMF phylotype patterns. Ordination results for fall and spring AMF sample sets are shown in Table 4.
For discriminant analysis, loadings (FAM-labeled TRFs) used in the analyses were derived from principal components determined using the
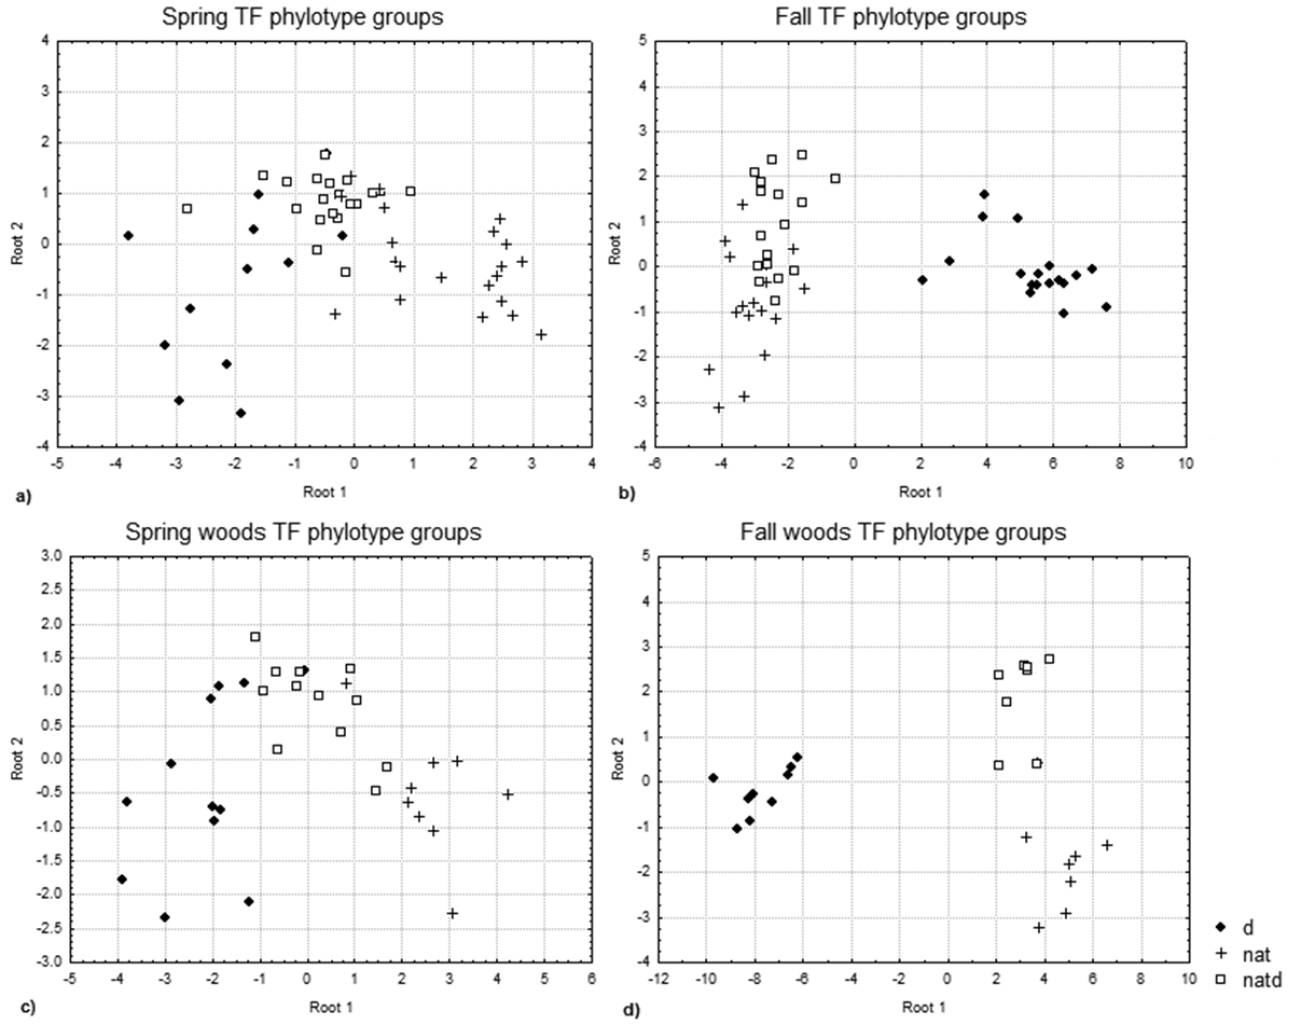
TF phylotype discriminant analysis plots for a spring (field and woodland), p = 0.0024, significant loadings = 150 basepairs (bp); includes dsv, goldenrod, anemone and meadow rue b fall (field and woodland), p= 0.0000, significant loadings = 142, 158, 321; includes dsv, goldenrod, wild ginger and raspberry c spring woods, p= 0.0045, significant loadings = 138 bp; includes dsv, anemone and meadow rue; and d fall woods, p= 0.0064, significant loadings = 138, 158 bp; includes dsv, wild ginger and raspberry. Distinct groups can be seen for DSV (d), natives growing in DSV (natd), and natives (nat) in the woodland data.
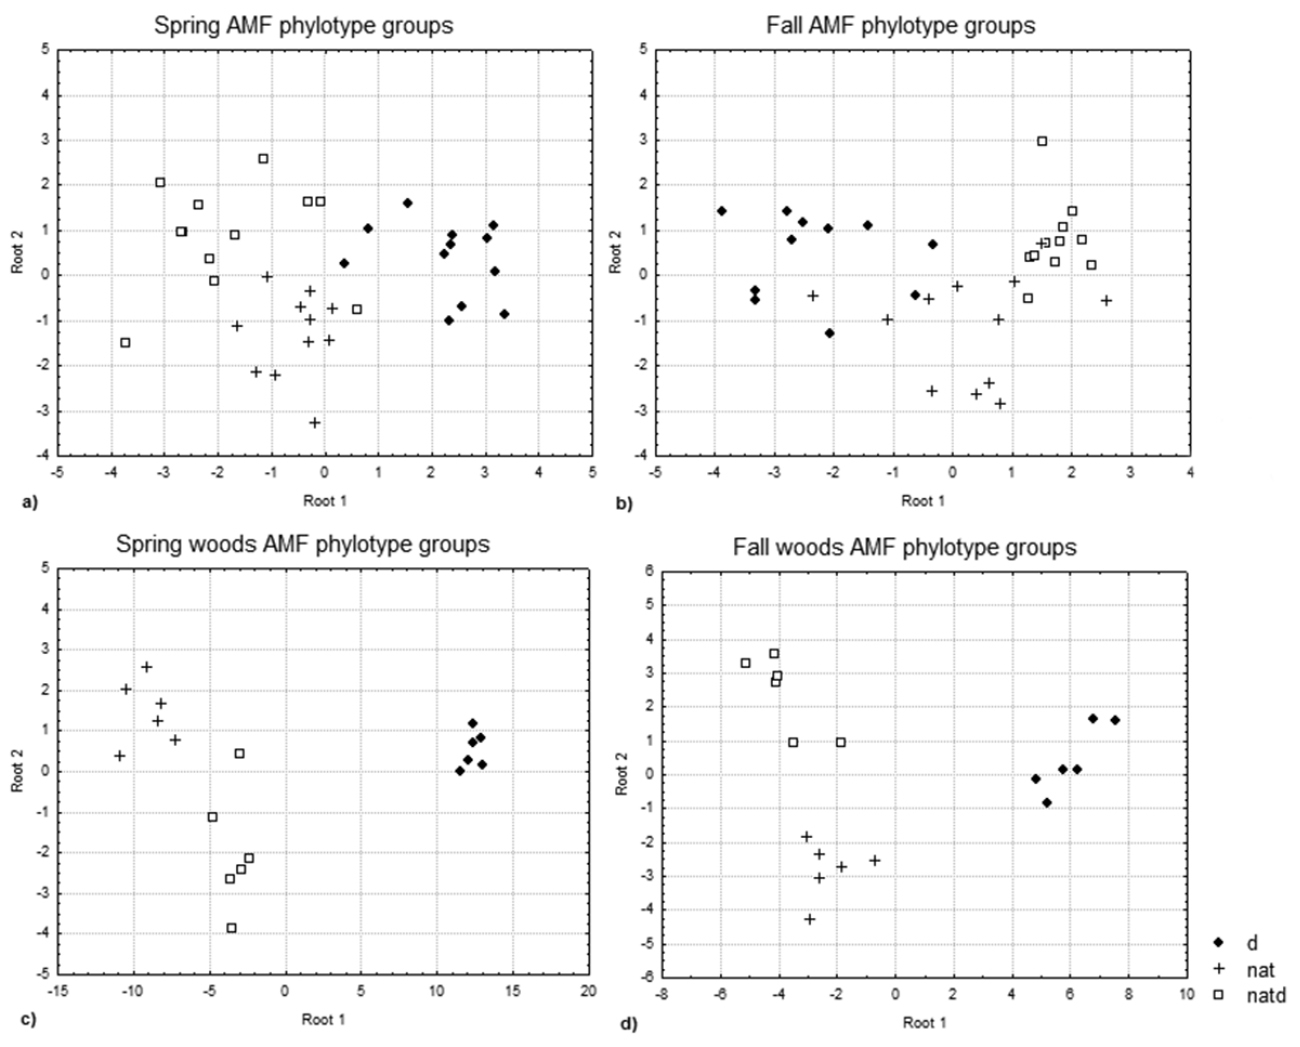
AMF phylotype discriminant analysis plots for a spring (field and woodland), p= 0.0049, significant loadings = 54 basepairs (bp) b fall (field and woodland), p= 0.0012, no significant loadings c spring woods, p= 0.0009, significant loadings = 54, 56, 65, 81, 85, 116, 272 bp; and d fall woods, p= 0.0036, significant loadings = 54bp. Distinct groups can be seen for DSV (d), natives growing in DSV (natd), and natives (nat) in the woodland data. Plants as in Figure 1.
Using the ratio of the average FAM peak height values to the extracted root DNA concentration per sample as a measure of fungal colonization density, we observed that the TF colonization of roots differed significantly between the natives and the natives-in-dsv, with the natives-in-dsv collectively averaging 1.9 times greater TF colonization densities (Student’s t-test, p= 0.00003; Appendix 1). As well, AMF colonization of roots differed significantly between the natives and the natives-in-dsv, with the natives-in-dsv showing a difference of 3.9 times greater average colonization densities (p = 0.002).
Collectively, there were significantly fewer FAM AMF phylotype variants in all samples (mean of 6.5±2.3) than TF variants (mean of 27.4±13.0), p = 0.0001. There was a significant difference in the number of TF phylotypes between DSV and natives, as well as between natives and natives-in-dsv (p = 0.0014 and p = 0.016, respectively using ANOVA, with Fisher’s LSD). The average number of TF phylotypes for DSV, natives-in-dsv, and natives were 31±11.6, 29±12.4, and 19±11.9 respectively (Table 5). There was no significant difference in the number of AMF phylotypes among the DSV, natives-in-dsv, and native TRFs (p = 0.95). However, there were observed differences in the phylotype occurrences between groups/plants (Appendices 2 and 3).
ANOVA analysis results showing difference in number of TF phylotypes for the groups DSV, natives-in-dsv (Nat-d), and natives growing separately from DSV (Natives).
| Host plant type | No. of root samples | Mean no. of TRFs | SD | p-values using Fisher’s LSD DSV Nat-d Natives |
||
| DSV | 24 | 31.4 | 11.6 | - | 0.001374 | |
| Nat-d | 24 | 28.5 | 12.4 | 0.39551 | - | 0.015563 |
| Natives | 24 | 19.4 | 11.9 | 0.001374 | 0.015563 | - |
| All groups | 72 | 26.6 | 12.6 | |||
The dominant FAM TF and AMF phylotypes for individual plant species is shown in Appendices 2 and 3, respectively. For the TF data, the spring goldenrod-in-dsv had greater or equal phylotype representation for all TRFs considered relative to goldenrod growing separately from DSV, while the fall goldenrod-in-dsv had greater or equal phylotype representation in all twelve dominant TRFs relative to goldenrod. For woodland plants, results were mixed with wild ginger-in-dsv showing greater phylotype representation in seven out of ten TRFs, meadow rue-in-dsv showing greater or the same phylotype representation in five out of eleven TRFs, raspberry-in-dsv showing greater or the same phylotype representation in six out of eleven TRFs, and anemone growing in DSV showing greater phylotype representation in seven out of eleven TRFs. Anemone-in-dsv had considerably more rare phylotypes (average of 61) relative to anemone (average of 9), the greatest difference between any native-in-dsv/native plant sampled. All TRFs found collectively in anemone-in-dsv samples (136 in total) were also found in the DSV samples except TRFs 236, 285, and 253bp. Six out of eight of the most dominant phylotypes in DSV (67bp, 134bp, 150bp, 224bp, 321bp, and 324bp) were significantly greater in natives-in-dsv relative to their native counterparts (Student’s t-test p = 0.04, 0.03, 0.003, 0.045, 0.03, and 0.05, respectively).
TRF 67bp was present in 88% of the total DSV samples, and TRF 324bp was present in 96% of the DSV samples. There was an increase in TRF 67bp representation in all natives-in-dsv relative to natives except anemone, which remained unchanged, and TRF 324bp representation in all natives-in-dsv groups except meadow rue (that showed a decrease in 324bp), suggesting that these phylotypes may be universally affected by DSV invasion. As well, 72% of the TF phylotypes that were dominant in DSV showed increased representation in the natives-in-dsv relative to natives (by varying amounts), and 23% of TF phylotypes not observed in DSV showed reduced representation in natives-in-dsv relative to natives. TRF 321bp, which was present in > 50% of the DSV samples, was only present in natives-in-dsv, with the exception of goldenrod. BLAST sequences were obtained for FAM TRFs 67bp, 138bp, 222–224bp, and 324bp (
For the AMF data, while significantly greater colonization densities were observed in the natives-in-dsv relative to the natives (as mentioned earlier), phylotype representation of the dominant TRFs in the invaded samples generally decreased relative to uninvaded samples (Appendix 3). The goldenrod-in-dsv had the same or reduced phylotype representation in six/seven out of nine TRFs (spring/fall respectively) relative to the goldenrod (growing separately from DSV). Woodland plants had mixed results with wild ginger-in-dsv showing reduced phylotype representation in seven out of nine TRFs, raspberry showing the same or reduced phylotype representation in five out of seven TRFs, anemone showing the same or reduced phylotype representation in six out of nine TRFs, and meadow rue showing the same or increased phylotype representation in five out of eight TRFs. TRF 54bp was present in only 29% of the total DSV samples, and TRF 81bp was present in 50% of the DSV samples. There was a reduced or maintained representation by TRF 54bp in all natives-in-dsv groups, suggesting that this phylotype is universally affected by DSV invasion. Similarly, reduced representation by TRF 81bp occurred in all natives-in-dsv relative to natives except fall goldenrod (increased levels). Only 22% of the TRFs that were dominant in DSV showed increased representation in the natives-in-dsv over natives for the AMF phylotypes, and 33% of TRFs not observed in DSV showed reduced representation in natives-in-dsv. BLAST sequences obtained for AMF were Glomus spp.
Disruption or alteration of soil fungi is one mechanism by which introduced plants are able to preferentially succeed in a novel environment (
We were able to show that native plants living in close association with DSV differ from those living distantly from DSV in that they have higher TF and AMF colonization densities, higher TF phylotype richness levels, and different TF and AMF community structures overall. We found that the AMF colonization density increased in native plants invaded by DSV collectively relative to uninvaded natives, an observation that has been supported by other researchers (
The majority of dominant TF phylotypes in DSV showed significantly increased representation in the natives-in-dsv over native counterparts. While the fungal species have not been elucidated in this investigation, there is a reasonable likelihood that a component of the observed increases in the general fungal phylotypes would include pathogenic or harmful fungi. We compared significant FAM- and HEX-labeled TRFs to BLAST sequences (
The use of relative fluorescence units:DNA concentration ratio as a proxy measurement of colonization density in this study is based on the assumption that DNA extraction efficiency across samples is comparable. Only the wild red raspberry may not be supported by this assumption as woody species are known to have tannins that can make DNA extraction more challenging. There is no assumption that this proxy for colonization density infers that the relative biomass of the various root samples is consistent. However, given that the same approximate amount of root tissue was used for the initial DNA extractions (i.e. 200 mg), and that there was high fidelity between replicates of both PCR amplification and T-RFLP runs, it is reasonable to conclude that normalized peak heights/DNA concentration provides an adequate proxy for colonization density. Though bias may result from differences among fungal types in the copy number of the targeted gene and differences in extraction efficiency (
It would be expected that the TF community in natives would be less diverse/abundant relative to natives-in-dsv if diverse fungi associated with invaders (that are not present in natives) are being introduced subsequent to invasion (
Soil fungi are an important consideration in plant fitness, plant community composition, and larger ecosystem processes, and as such, alterations to fungal communities is one likely means to successful invasion by introduced plant species. Elucidating invader fungal association dynamics could support strategies used by restoration ecologists in reclaimed sites where fungal inoculation is being considered. Given the findings of this and other related studies, further investigations into the general fungal and AMF association dynamics pre- and post-invasion are strongly warranted.
We thank the Toronto Zoo for providing site access for plant collections, as well as two reviewers for their valuable suggestions and comments. The work was supported by Natural Sciences and Engineering Research Council of Canada (NSERC).
Data for the genomic DNA concentrations of root samples and relative fluorescence unit intensities (RFUs). (doi: 10.3897/natureconservation.4.3578.app1). File format: MS Word Document (doc).
TF phylotype occurrences in natives and natives growing in DSV. Natives are depicted with dark bars and natives-in-dsv are depicted with light bars. The x-axis shows the dominant phylotypes occurring in all plants (basepair length), and the y-axis shows the % of samples with representation by a particular TRF. (doi: 10.3897/natureconservation.4.3578.app2). File format: Tagged Image File Format (tiff).
AMF phylotype occurrences in natives and natives growing in DSV; details as in Appendix 2. (doi: 10.3897/natureconservation.4.3578.app3). File format: Tagged Image File Format (tiff).