ZooKeys 5: 53–73, doi: 10.3897/natureconservation.5.4634
Spatio-temporal patterns of wildlife-vehicle collisions in a region with a high-density road network
Kevin Morelle 1, François Lehaire 1, Philippe Lejeune 1
1 Department of Forest, Nature and Landscape, Gembloux Agro Bio-Tech, University of Liege, 5030 Gembloux, Belgium

Corresponding author: Kevin Morelle (kevin.morelle@ulg.ac.be)

Academic editor: Y. Matsinos

received 6 January 2013 | accepted 6 October 2013 | Published 13 November 2013


(C) 2013 Kevin Morelle. This is an open access article distributed under the terms of the Creative Commons Attribution License 3.0 (CC-BY), which permits unrestricted use, distribution, and reproduction in any medium, provided the original author and source are credited.


For reference, use of the paginated PDF or printed version of this article is recommended.

Citation: Morelle K, Lehaire F, Lejeune P (2013) Spatio-temporal patterns of wildlife-vehicle collisions in a region with a high-density road network. Nature Conservation 5: 53–73. doi: 10.3897/natureconservation.5.4634

Abstract

This paper is the first to report data on wildlife-vehicle collisions (WVC) in Wallonia, southern Belgium, characterised by one of the densest road network worldwide. With the collaboration of police we identified 3965 accidents involving “free ranging animal” between 2003 and 2011. We observed that these accidents with free ranging animals result in 13% of cases in injuries for the drivers or passengers, and in less than 1% of cases in fatalities (death). 78% of these casualties involve wild animals, among which wild boar take the largest part (39% ). During the covered period we observed an annual increase of WVC of 21%. For wild boar and red deer, this increase was significantly correlated with hunting statistics, used as an index of population density. The temporal analysis demonstrated an increase of WVC during night time with peak of accidents at dusk and dawn. Monthly distribution revealed the role of breeding, dispersal and hunting in shaping temporal patterns of accidents. Spatial analysis, focusing on wild boar, roe deer, red deer and red fox demonstrated clustering of accidents for all these species, until scale between 20 to 70 km. Mapping of accidents via Kernel density analysis permitted us to highlight areas with high risk of WVC risk. Our study suggests that the problem of car accidents due to wildlife is an increasing concern in Wallonia but results on spatial and temporal patterns should help for setting up mitigation measures in the most sensible areas. Moreover we suggest that police data source should be used for nationwide analysis and for comparison between countries.

Keywords

Wildlife-Vehicle Collisions (WVC), roads, spatio-temporal distribution, Wallonia

Introduction

These last decades, simultaneous increase in infrastructure networks and ungulates populations (Burbaitė and Csányi 2010; Milner et al. 2006; Saez-Royuela and Telleria 1986) has lead to an increase in the number of wildlife vehicle collisions (Groot Bruinderink and Hazebroek 1996; Romin and Bissonette 1996; Seiler 2004). WVC have important social, economic and ecological consequences. Socially, WVC threaten traffic and human safety and cause injuries, trauma and in some cases death of car drivers or passengers (Williams and Wells 2005). Although WVC involve any size of species, car damage, injuries or fatalities are mostly caused by collision with larger species (> 30kg) (Barthelmess and Brooks 2010; Ford and Fahrig 2007). Economically, these accidents have also high impact through vehicle damage. Hence, in France this cost has been evaluated to 200 million euros for the year 2003, five times more than the cost of damage to agriculture by wildlife for the same year (Vignon and Barbarreau 2008). Ecologically, WVC induce population reduction (Lodé 2000) and can impact differently animal populations (Bissonette and Adair 2008). It can affect weakly animal population when accounting for a small part only of the population mortality (Groot Bruinderink and Hazebroek 1996), moderately when reaching mortality level equal to hunting activities (Forman and Alexander 1998; Gosselink et al. 2007) or greatly in some cases when population viability is threaten (Huijser and Bergers 2000; Kramer-Schadt et al. 2004). Roadsalso act as barriers to animal movement within the landscape causing local population disappearance (Shepard et al. 2008) and isolating animal population on several unconnected subpopulations under higher risk of extinction (Lodé 2000). Transport infrastructures also induce habitat modifications and landscape fragmentation (Forman and Alexander 1998).

To develop effective mitigation measures, knowledge about location and time of road casualties involving wildlife is required. It is important that every country undertakes road ecology researches because any situation is specific and can bring new relevant information on patterns of WVC. Moreover standardised data collection at national scale could help facilitating meta-analysis (Knapp 2005), understanding effect of density and configuration of transport infrastructure on ecosystems functioning at broader scale (van der Ree et al. 2011) and facing the problem of time and space extrapolation (Roedenbeck et al. 2007). Road ecology requires thus now more collaboration between countries to develop adapted mitigation strategies and improve road planning in areas where transport network is still under development.

Literature about factors explaining wildlife-vehicle collisions is abundant, demonstrating the importance of this topic. During these last years many studies have brought up results on WVC for numerous countries, e.g. Spain (Colino–Rabanal et al. 2012; Diaz-Varela et al. 2011; Lagos et al. 2012; Rodríguez-Morales et al. 2013), Hungary (Cserkész et al. 2013; Markolt et al. 2012), Sweden (Neumann et al. 2012), Poland (Tajchman et al. 2010), USA (Danks and Porter 2010), Ireland (Haigh 2012). Road characteristics, traffic volume, drivers visibility and intersection of roads are important causes of WVC (Colino–Rabanal et al. 2012; Gunson et al. 2011; Madsen et al. 2002; Seiler 2004). Temporal trends in number WVC are known to match animal behavior and biology, with WVC occurring mainly during breeding and dispersal period at a seasonal scale, or to daily foraging and resting requirement of animal (Groot Bruinderink and Hazebroek 1996; Haigh 2012; Diaz-Varela et al. 2011).

However, in Wallonia, southern part of Belgium (Figure 1), no published data on accidents involving large species has been published so far. Contrary to Flanders (northern part of Belgium), Wallonia was not part of the COST 341-project ‘Habitat Fragmentation due to linear Transportation infrastructure’ (Damarad and Bekker 2003). Regionalisation of competency such as road and environment management in Belgium creates such reared situation where one part of the country might be involved in a project but not the other one. Currently, the only published data on WVC in Belgium is from Holsbeek et al. (1999) who showed how Belgian road network affects small to medium size mammals and birds. Particularly, this study showed the importance of hedgehog and red foxes in WVC, accounting for 60% of total animals found killed. Holsbeek et al. (1999) estimated the number of animal roadkills in Belgium to 4 000 000. The absence of more published results on road ecology in Belgium can also be explained by the scattered information between insurance companies, forest state, local authorities, police, hunters and environmentalists (personal observation).

Figure 1.

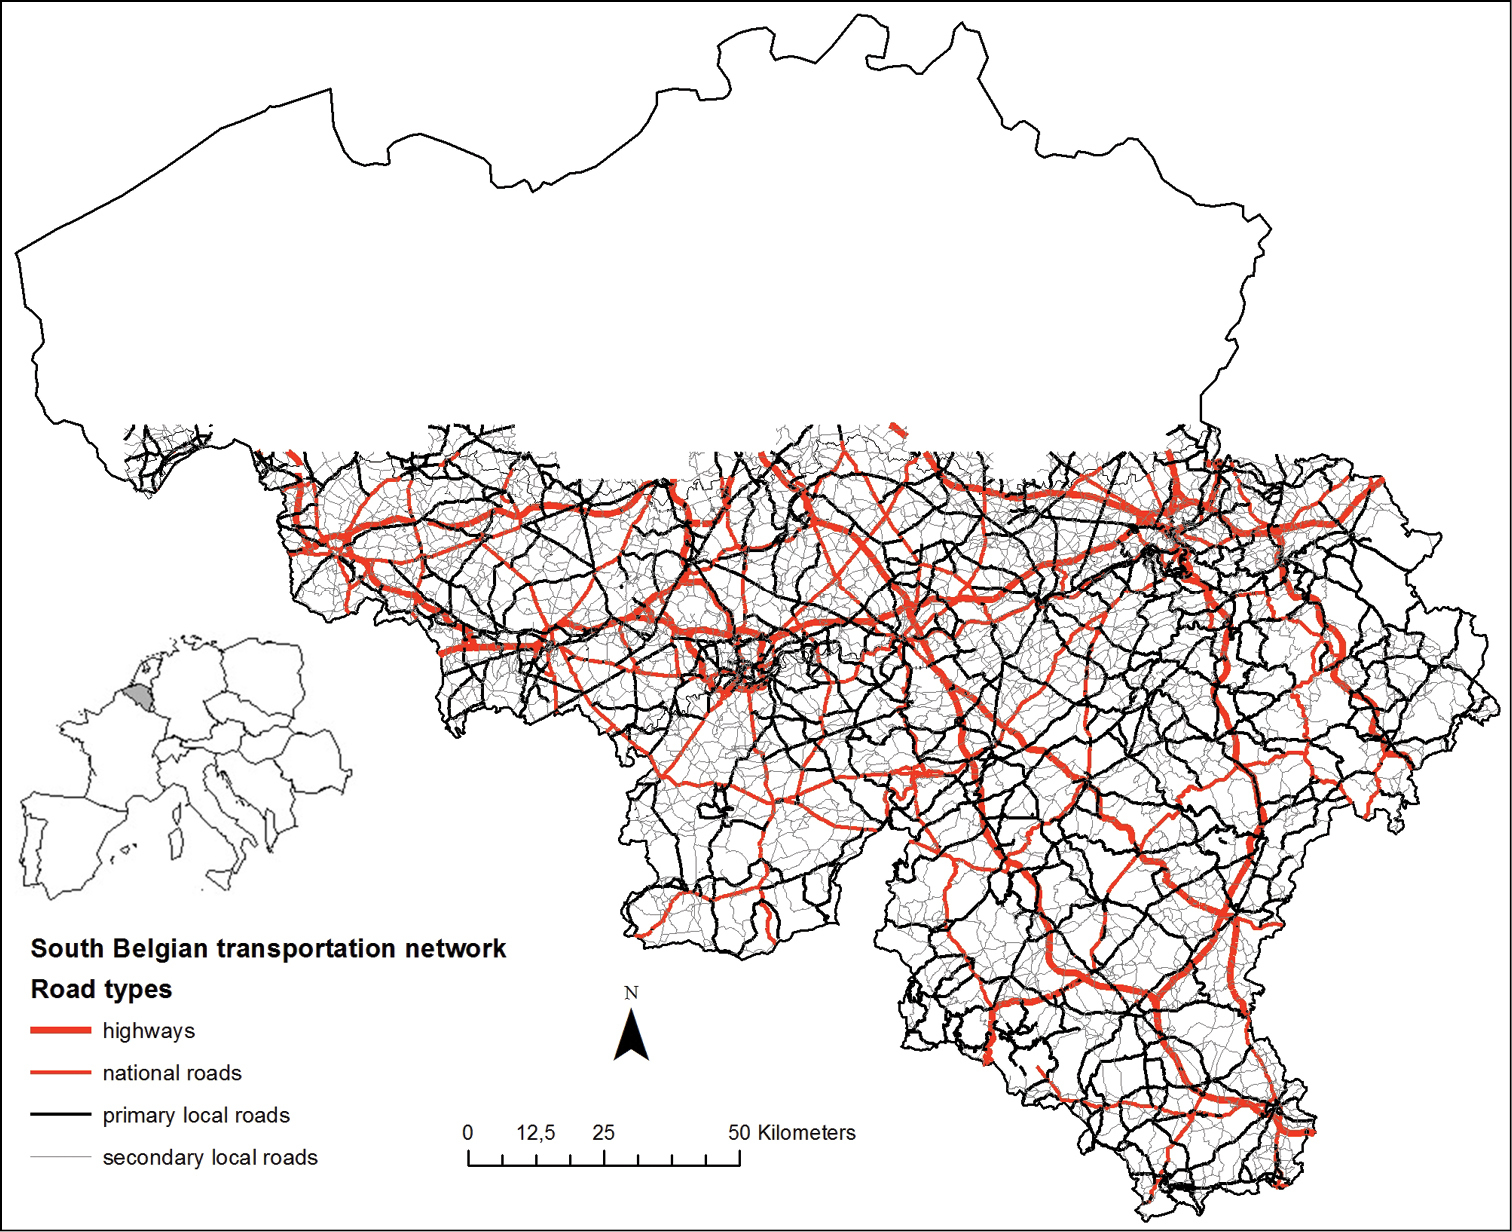
South Belgian (Wallonia) and its road network within Europe and Belgium.

With its 4.8km/km2 of public roads, Southern Belgium (Wallonia) has one of the densest road networks of Western Europe combined to high human population density of 209 inhabitants per km2 (SPW 2012). Although, the Belgian road network is already developed since decades and has not seen great changes lately, the car fleet number has hugely increased between 1977 (3 315 071 vehicles) and 2011 (6 861 777 vehicles). Due to a particularly dense road network (Figure 2), an increasing game species populations (red deer, roe deer and wild boar) and the current lack of available statistics, Wallonia is an interesting region to study the patterns of animal road accidents.

Figure 2.

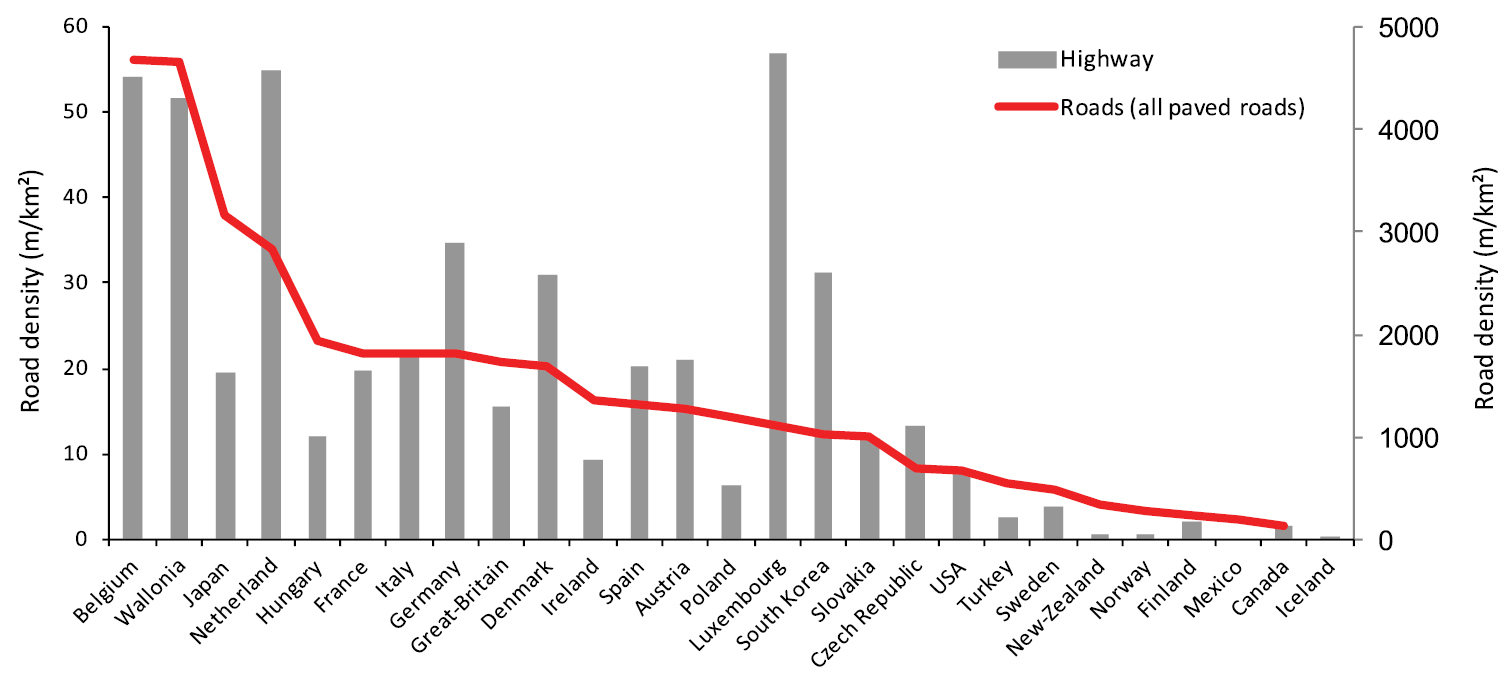
OECD countries classified according to their roads and highways density (OECD Factbook 2008: Economic, Environmental and Social Statistics, SPF Mobility and Transport).

The aim of our research is toprovide the first results of spatial and temporal patterns of WVC for southern Belgium. In particular we analysed casualties regarding their specific composition (percentage of involved species), and for main game species (red deer Cervus elaphus, roe deer Capreolus capreolus, wild boar Sus scrofa and red fox Vulpes vulpes) causing most important social and economic damages, we analysed temporal (annually, monthly, daily and hourly) and spatial distribution patterns.

Methods

Our study area is the Walloon region, southern part of Belgium (50°30N, 4°45E, Figure 1). Climate is sub-oceanic temperate with a mean annual temperature of 8°C and a mean monthly temperature varying between 2 to 16°C. The mean annual rainfall is 900mm, and the mean annual length of snow cover is over 25 days. Roe deer, red deer and wild boar are the most abundant wild ungulates.

Data sources used to investigate accidents involving animals are manifold: insurance companies (Inbar et al. 2002; Vignon and Barbarreau 2008), local management authorities (Baker et al. 2004), traffic safety authorities (Colino-Rabanal et al. 2012; Diaz-Varela et al. 2011), systematic road monitoring (Hell et al. 2005) or police database (Balčiauskas and Balčiauskienė 2008). Apart from systematic observations on road sections, most of these methods cannot be considered as exhaustive since they are dependent on many factors (e.g. casualties’ record by police/insurance or volunteer participation in data retrieval) preventing collection of all WVC cases (personal observation). In our study, we opted for data from the police considering its availability and its relatively standardised collection protocol. Indeed, although the method is likely to underestimate the total number of accidents, as police is not called in every casualties cases, we assumed that impact with large mammals (wild boar, roe deer, red deer and red fox) have higher chance to end into important car damage requiring police intervention and report. We thus hypothesized that for the species of interest information from police provide the most representative dataset of the number of animal-related accidents.

We investigated police database to search for traffic accident involving any domestic or wild animal species. Information’s on accidents resulting in injuries or fatalities were directly available from the central police database, while for accidents resulting in car damages each paper statement had to be checked out individually. In total, the collected data cover the period between 2003 and 2011, and consist of 3965 accidents. For each event we recorded date, time, species involved, and information about the location when available. From the 3965 accidents, 51% could be georeferenced by their milestone reference or by a detailed description of the location with an accuracy of 100m. Milestone references or detailed location were then exported into X Y value by using the corresponding value from the Wallonia road agency.

Exploratory analysis aimed at identifying species involved by calculating absolute and relative frequency of WVC occurrence for each category of species.Types of roads on which accidents occurred were also identified. For the temporal and spatial patterns analysis we only considered the following main game species: red and roe deer, wild boar and red fox. The reason for this choice is twofold. Firstly, they are the main species involved in WVC with social and economic consequences for which mitigation measures are required. Secondly, data available in police database contain only cases where at least car damages occur, preventing exhaustive information on WVC with small mammals to be analysed.

Temporal analysis focused on annual, monthly, weekly and daily distribution patterns of WVC. For each of these timescale, we looked for differences in roadkills relative frequency by using chi-square goodness-of-fit test (Greenwood and Nikulin 1996). Using radar charts in Excel (Microsoft Corp. 1985–2007), we compared hourly distribution of accidents involving wild and domestic species (Lagos et al. 2012). We considered all the WVC from the study period together as we did not observe year effect on the temporal patterns.

For the spatial analysis we only consider accidents that occur along highways and national roads, due to the high complexity of the local road network and the relative low number of WVC compared to the total length of the road network. In total, we had thus a dataset composed of 840 casualties (Figure 3). Spatial pattern of WVC was assessed in three steps.

Figure 3.

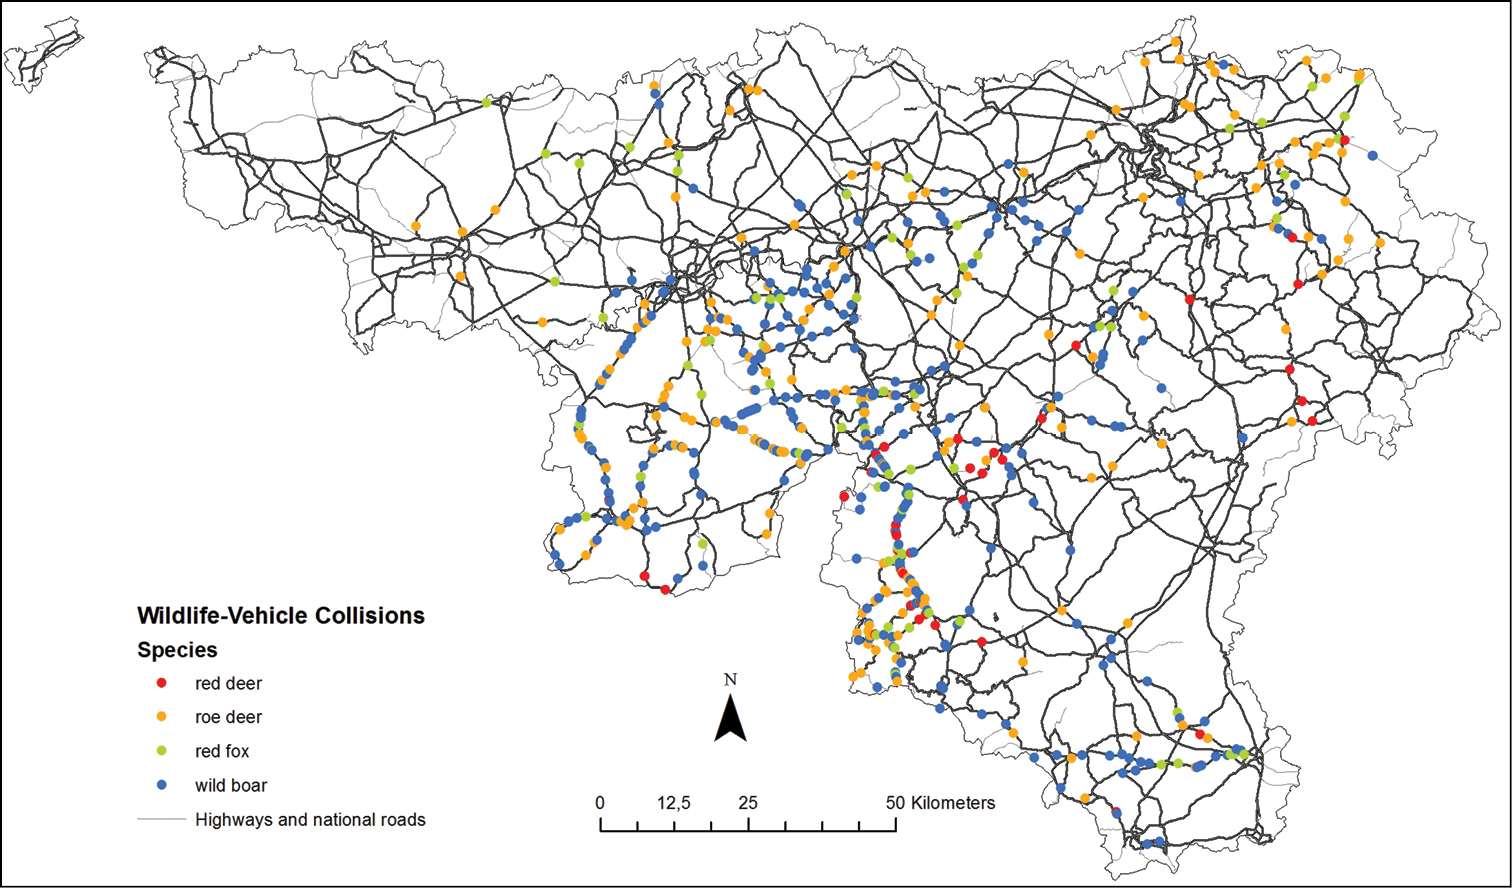
Distribution of WVC along highways and national roads.

In a first step, we used nearest neighbour distance (NND) to assess the distribution of animal-related casualties along the road network (Gonser et al. 2009). For each species, we compared the observed mean distance of each accident to its nearest neighbour with the expected mean distance if accidents were randomly distributed along road (CRS, complete spatial randomness). NND analysis allows to determine whether WVC are aggregated or not along the road network. We compared observed value to 100 Monte Carlo simulations of a random distribution that allows estimating mean and confidence intervals at 5% for expected value. If the observed value is higher than the upper confident interval, points are aggregated, otherwise under the lower confidence interval, points are dispersed (Okabe et al. 2013). Departure from a random distribution was confirmed by calculating the Clark-Evans index which is the ratio of observed and expected mean distance, values >1 indicating points are aggregated, otherwise points are dispersed (Clark and Evans 1954).

In a second step, we identified hot spot of collisions for each species by means of a kernel density analysis (Bailey and Gatrell 1995; Okabe et al. 2009). Kernel density expresses the number of collision per kilometer of roads for all the of species of interest. Mapping kernel density allows identifying hotspot zones where mitigation measures should be set up. We used a bandwidth of 500m as the search radius for calculating the number of accidents, to estimate a density value. This value of 500m is reasonable to discriminate priority areas on which implement mitigation measures should be developed (Conruyt-Rogeon and Girardet 2012). Estimated densities were then classified using the Jenks methods, based on minimization and maximization of variance respectively, within and between density classes (Jenks and Caspall 1971).

In a third step, we examined spatial structure of WVC at various spatial scales using the Ripley K function describing distribution patterns of points in space at different scales (Mountrakis and Gunson 2009; Ripley 1976). Originally this function is used for 2-D applications. Here to consider 1-D issue of point distributed along a line, we used the Global auto K function provided by the SANET tools under ArcGIS 10 (Okabe and Yamada 2001). For each WVC cases, the number of neighbors WVC is calculated at spatial scales multiple of 500m along the road network. For detecting deviations from spatial homogeneity, we used the L-function, a variant of the Ripley’s K for testing range of spatial structure (Bailey and Gatrell 1995). This L-function is the difference between the observed and expected K-values at each spatial scale r (Clevenger et al. 2003; Langen et al. 2012) and presents the advantage compared to the K-function to be normalized at 0 (representing random distribution). Expected values (mean and 95% CI) were calculated using 100 Monte-Carlo simulations of random points distributed along the road network. Observed L(r) values were then plotted against the expected values. At each scaled distance r, the value of L(r) above or under the 95%CI revealed respectively an aggregated or a dispersed distribution of WVC along the road network.Due to the small number of WVC relative to full Walloon road network, we perform this third analysis on a sub-region that contains the highest density of WVC as indicated by the kernel density map.

All the spatial analyses were performed with the use of the extension SANET® 4.1. Beta for ArcGIS 10 which provides tools adapted to perform spatial analysis along linear features (Okabe et al. 2006).

Results
Species composition

In total 14 different species were identified: 5 domestic species representing 13% of accidents cases and 9 wild species representing 78% of accidents, the rest was undetermined species (Table 1). For the domestic species, dogs take the largest part of accidents with close to 10%, while wild boar and roe deer are together responsible of 45% of accidents with wild animals. 13% of accidents resulted in human injuries or death and the rest resulted in car damages. 7% of casualties occur on highways, 50% on national roads and 43% on regional or local roads.

Table 1.

Species involved in road accidents in Wallonia between 2003 and 2011.

No human injuries Human injuries Total
Number Percentage Number Percentage Number Percentage
Domestic species
Dog 262 6.61 120 3.03 382 9.63
Horse 24 0.61 24 0.61 48 1.21
Cow 28 0.71 19 0.48 47 1.19
Cat 26 0.66 11 0.28 37 0.93
Pig 0 0.00 1 0.03 1 0.03
Total domestic species 340 8.58 175 4.41 515 12.99
Wild species
Wild boar 975 24.59 81 2.04 1056 26.63
Roe deer 682 17.20 30 0.76 712 17.96
Fox 279 7.04 14 0.35 293 7.39
Red deer 244 6.15 28 0.71 272 6.86
Badger 147 3.71 5 0.13 152 3.83
Pheasant 89 2.24 2 0.05 91 2.30
Hare 59 1.49 1 0.03 60 1.51
Bird 53 1.34 4 0.10 57 1.44
Rabbit 15 0.38 0 0.00 15 0.38
Fallow deer 6 0.15 1 0.03 7 0.18
Bighorn 4 0.10 2 0.05 6 0.15
Weasel 2 0.05 0 0.00 2 0.05
Red squirrel 1 0.03 0 0.00 1 0.03
Raccoon 1 0.03 0 0.00 1 0.03
Unspecified ungulates 361 9.10 24 0.61 385 9.71
Total wild species 2557 64.49 192 4.84 3110 78.44
Undetermined 199 5.02 141 3.56 340 8.58
Total 3457 87.19 508 12.81 3965 100.00
Temporal distribution

WVC increased by 117% during the study period. Specifically roadkills increased by 50% for badger, by 193% for red deer, 242% for roe deer, 194% for wild boar and 52% for red fox (Figure 4). Abundance indexes coming from hunting bag records (annual number of shot animal) were highly (0.89 for wild boar and 0.67 for red deer) to poorly (-0.07 for roe deer) related to number of accidents.

Figure 4.

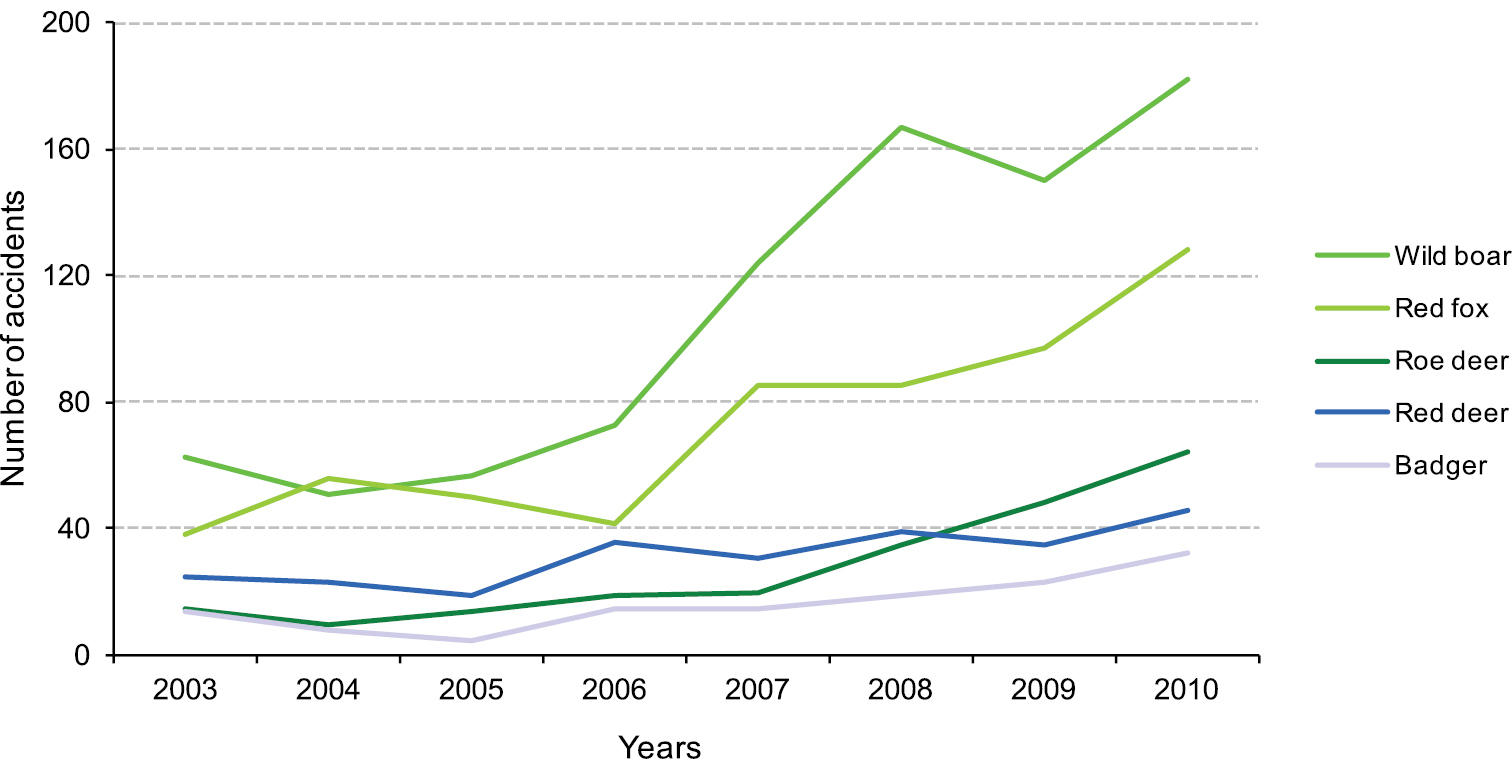
Annual variation of the number of accidents involving badger, red fox, roe deer, red deer and wild boar.

All the game species investigated showed not uniform monthly distribution of accidents (Figure 5). Casualties with red deer (χ2 = 41.6, df = 11, p < 0.001) increase in April-May and then from September to November. For roe deer (χ2 = 70.4, df = 11, p < 0.001) accidents peak also in April-May and then in October-November. Wild boar (χ2 = 456.9, df = 11, p < 0.001) have their maximum from October to December, while red fox (χ2 = 32.6, df = 11, p < 0.001) accidents are more evenly distributed with peaks in January, May and October-November.

Figure 5.

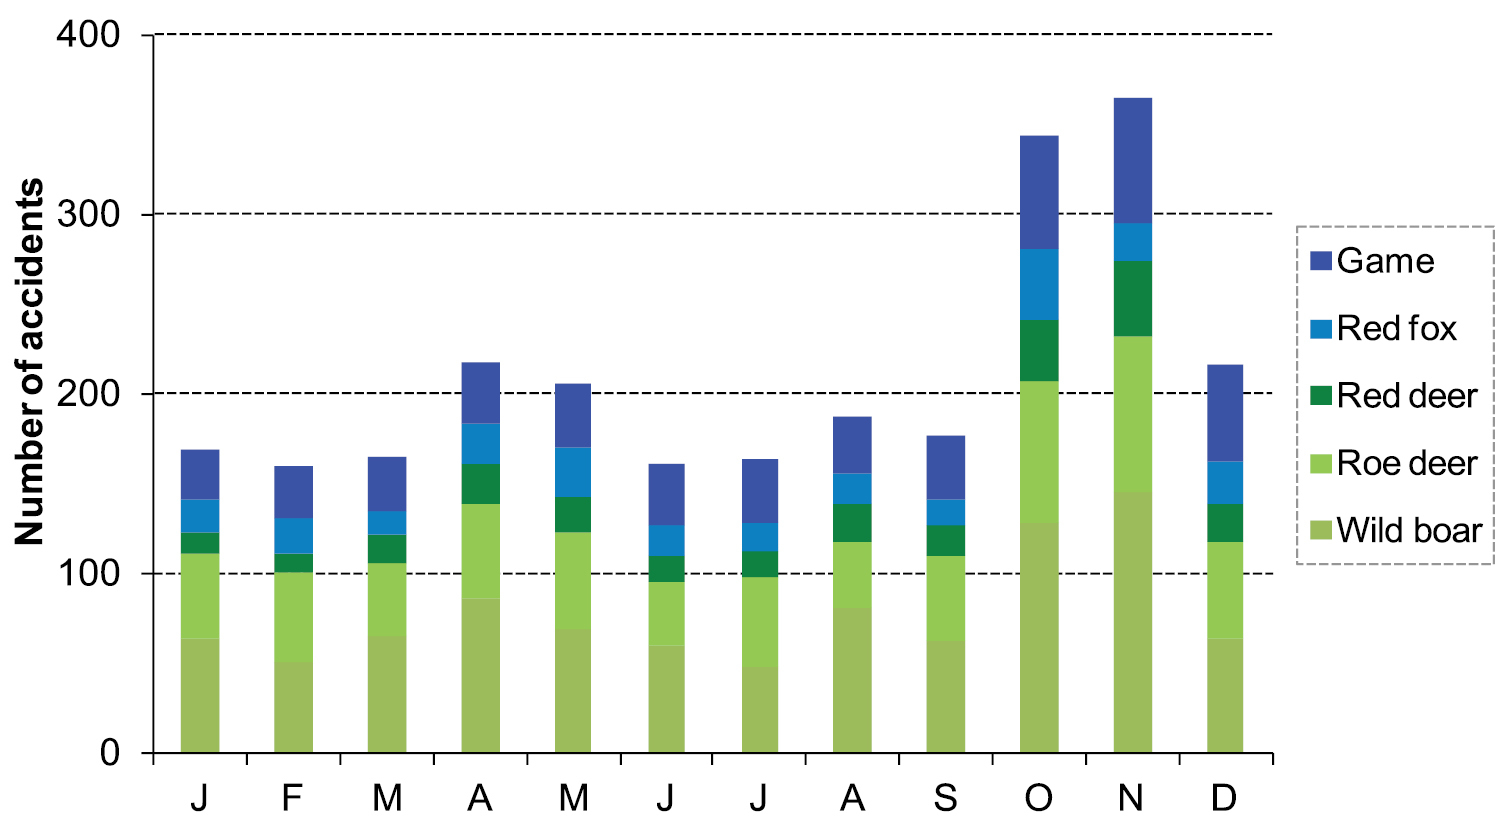
Monthly distribution of road casualties for red fox, red deer, roe deer, wild boar, and others undetermined game species.

Although we could visually observe an increase in the number of accident occurrences during weekend for wild boar, we did not observe significant differences with other days of the week (Figure 6).

Figure 6.

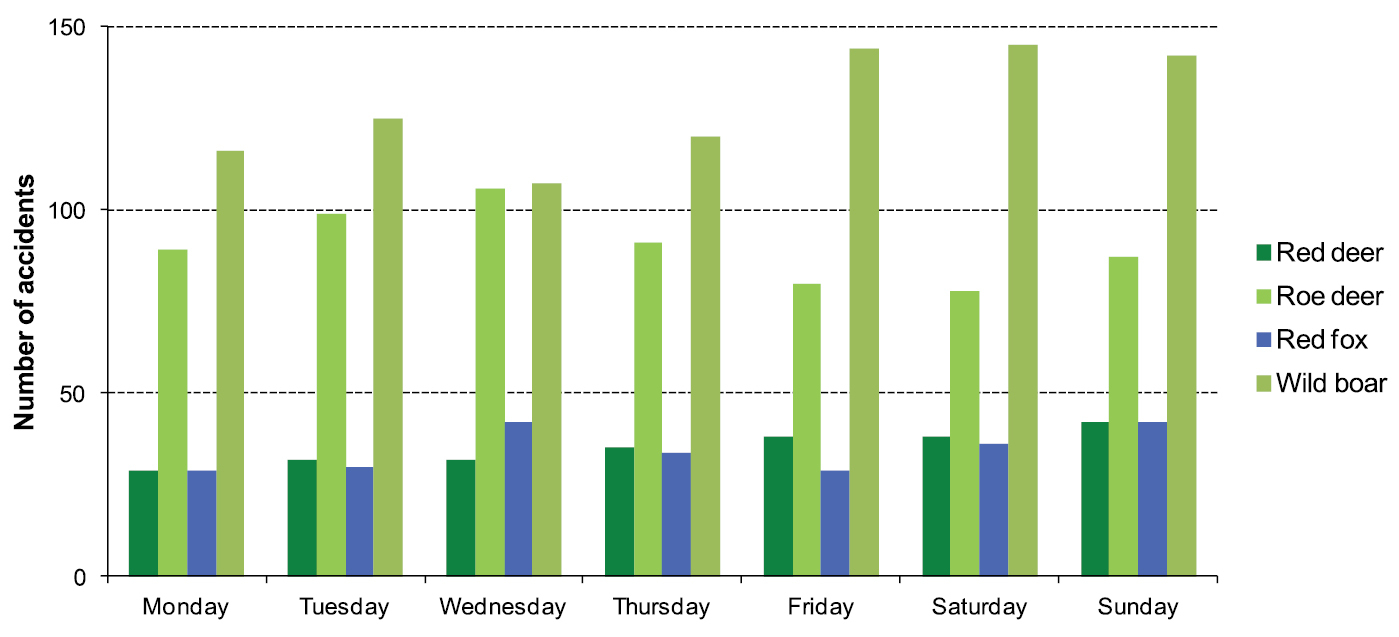
Daily distribution of road casualties for red fox, red deer, roe deer and wild boar.

Hourly distribution for both wild (χ2 = 959.2, df = 23, p < 0.001) and domestic (χ2 = 87.2, df = 23, p < 0.001) species was not uniformly distributed. WVC show tendency towards night and morning distribution while collisions with domestic species are more evenly distributed during daytime with peak between 5 and 7 pm (Figure 7).

Figure 7.

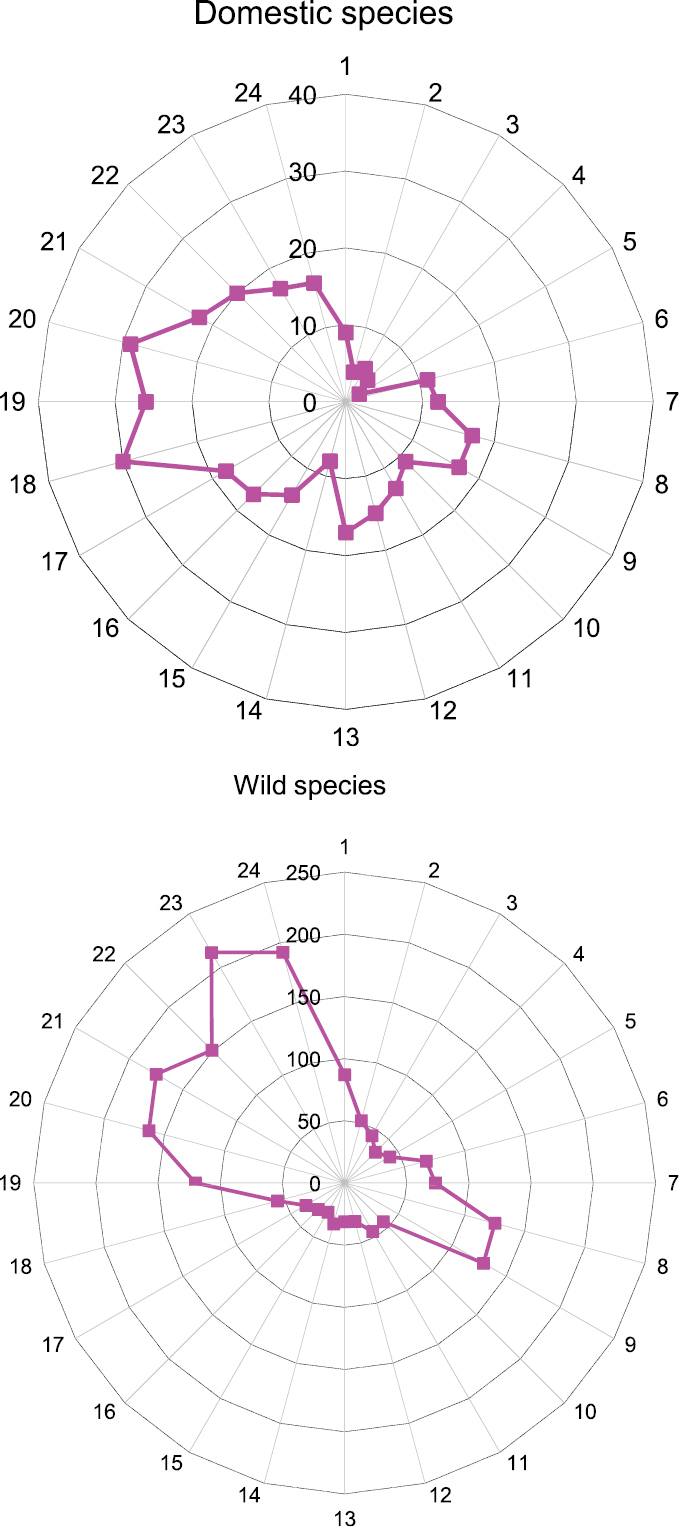
Hourly distribution patterns of road accidents for wild and domestic species.

Spatial patterns

We observed that all game species were not randomly distributed along highways and national road network (Table 2, nearest neighbour distance and Clark-Evans index).

Table 2.

Results of the spatial distribution patterns analysis with the Clark-Evans index (value > 1 for aggregated distribution) and P-value for Nearest Neighbour Distance analysis.

Species n Clark-Evans index CRS (NND)
All 840 0.52 p < 0.05
Red deer 56 0.41 p < 0.05
Roe deer 260 0.63 p < 0.05
Wild boar 421 0.46 p < 0.05
Red fox 103 0.51 p < 0.05

Kernel density analysis revealed heterogeneous distribution WVC along the road network (Figure 8). Concentration of accidents for all species is observed in the centre-south of Wallonia.

Figure 8.

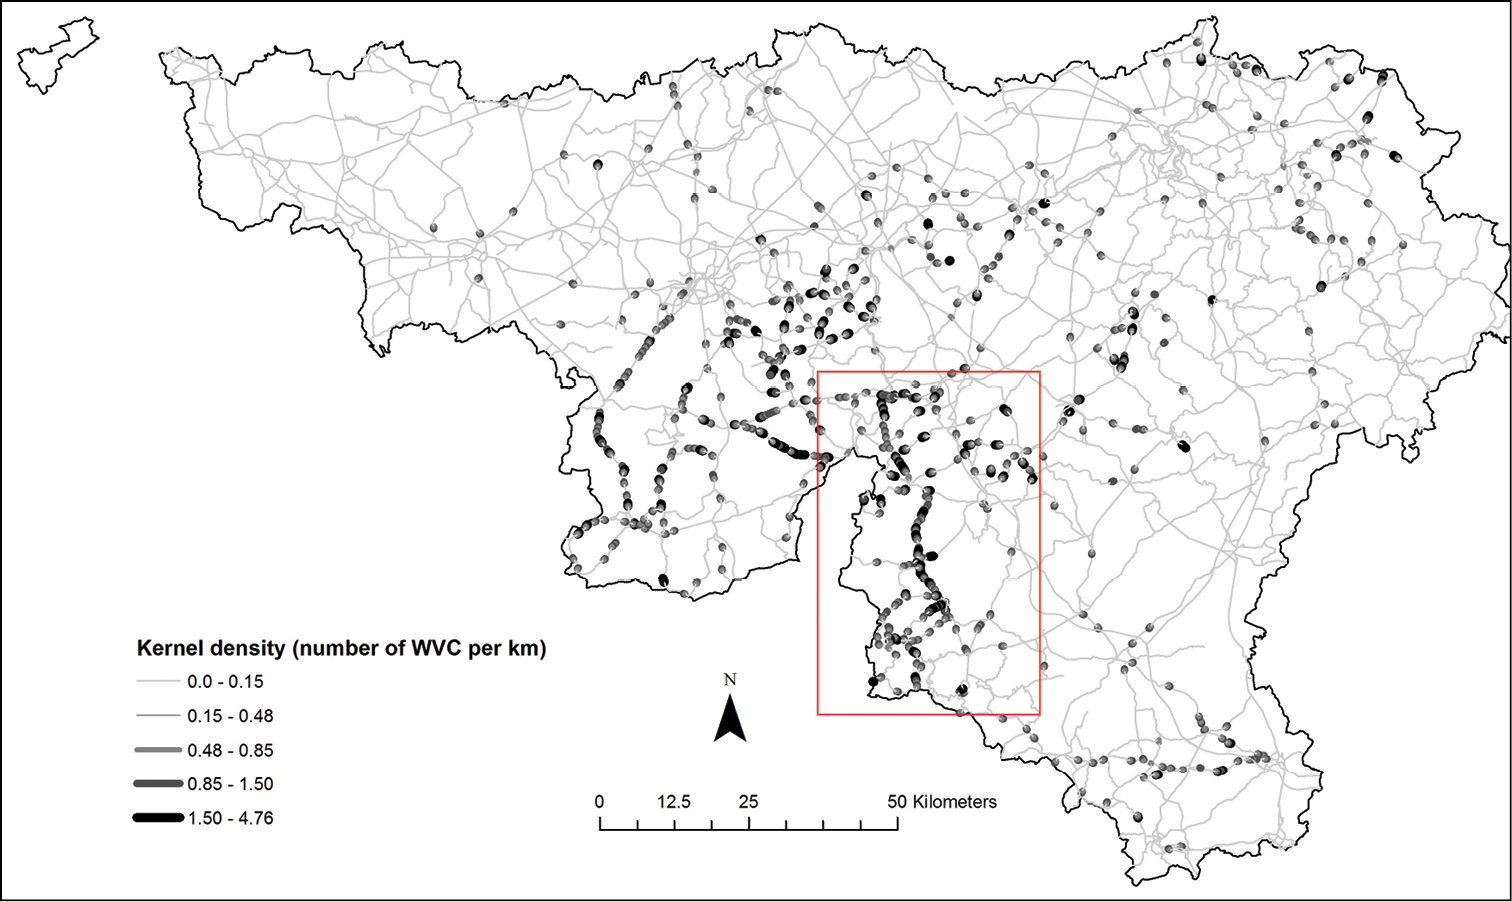
Kernel density estimation for WVC considering all species across the whole area and study period (2003–2011). Bandwidth used was 500m and cell size was 50m. In red, the delimited area concentrating high risk areas where the spatial structure analysis (K and L-function) was performed.

For all the species but roe deer, distribution of roadkills followed the same patterns, with significant clustering at scale ranging from one to more than fifty kilometres (Figure 9). While wild boar and red fox accidents become randomly distributed at large scale (> 60 km), red and roe deer accidents, quickly switch from a clustered to a dispersed distribution. For roe deer, clustering of accidents occurred until a scale of twenty kilometres and at scale higher than forty kilometres distribution becomes dispersed (Figure 9).

Figure 9.

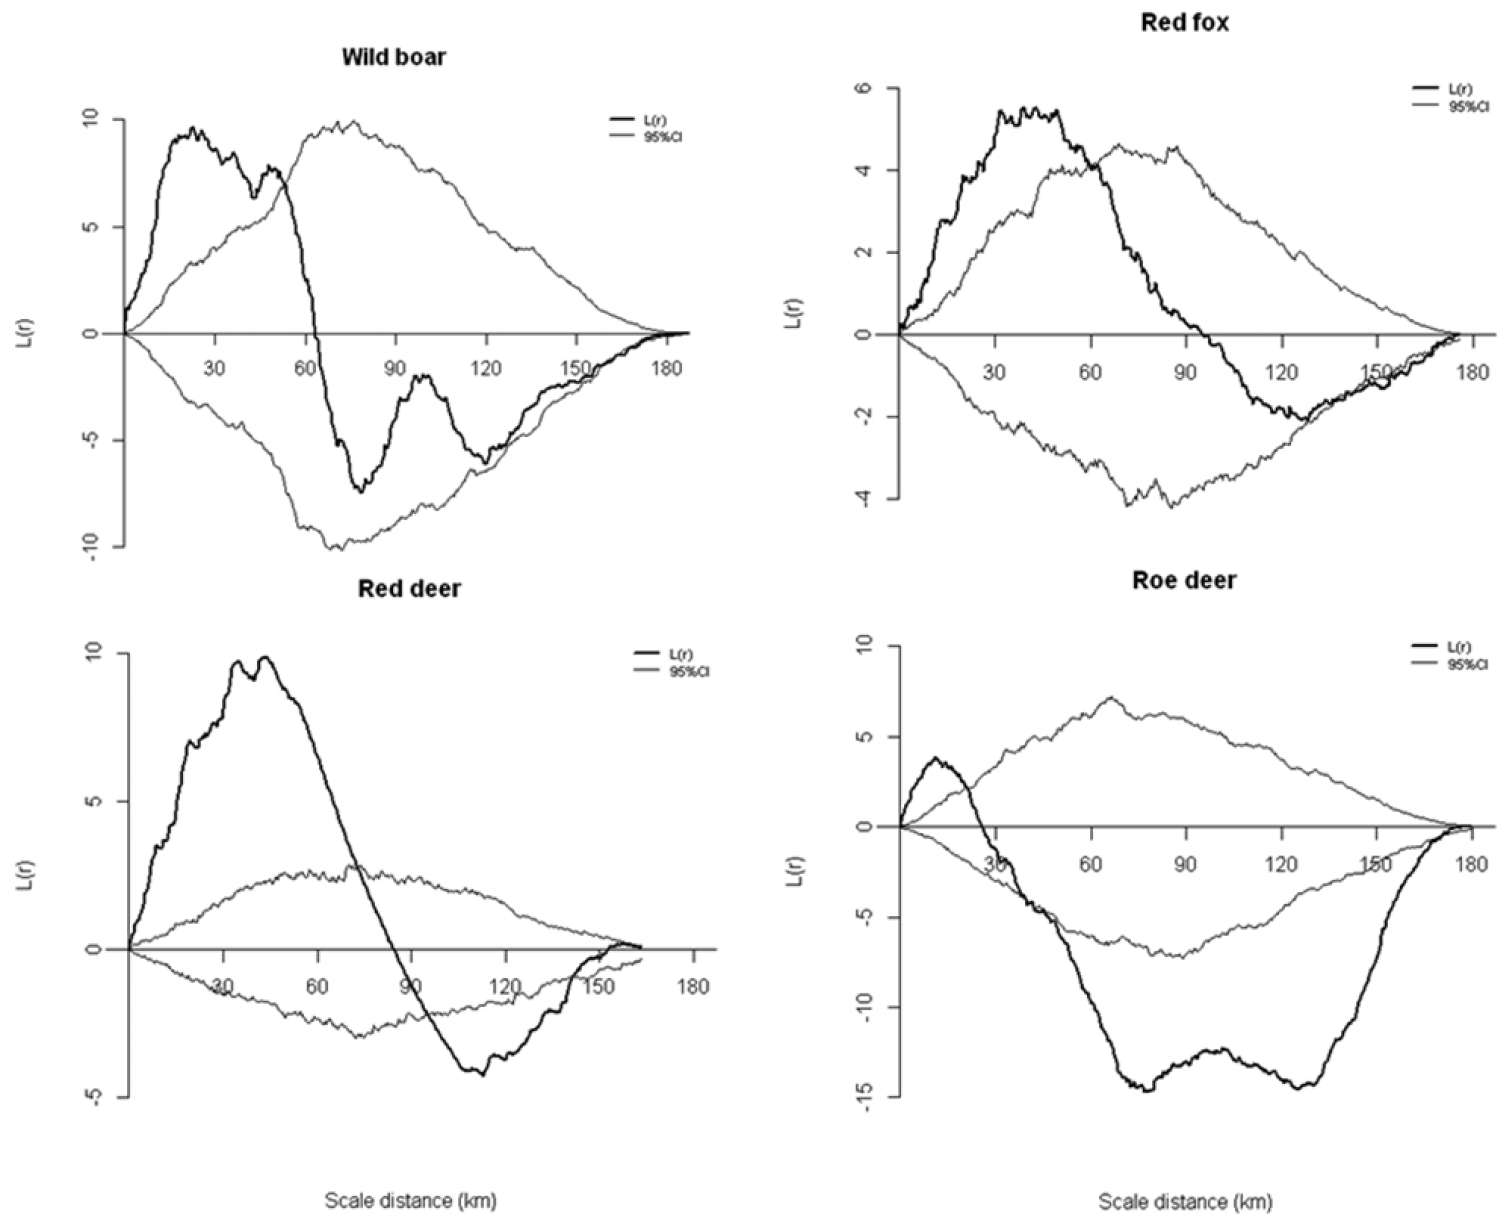
Plot of the L-statistic as a function of scale for distribution of the four main game species roadkills on the selected area of Wallonia. Solid lines represent the observed number of neighbors per roadkill event along the road minus the expected number of neighbors if the roadkills were randomly distributed. Roadkills are significantly clustered (P < 0.05), dispersed or randomly distributed at scale r when, respectively, L(r) is above, under or within the 95% confidence interval.

Discussion

We observed that 87% of accidents with animals result in car damages, which is in accordance with a study by Williams and Wells (2005) who found a value of 80%. Most of these accidents are caused by wild animals which are in accordance with what has been observed in Europe and North American. Large mammals (over 30kg), usually ungulates, are indeed known to be more frequently involved in collisions with vehicles (Conover et al. 1995; Putman 1997). We didn’t achieve in deep review of the causal factors of accidents with domestic animal, however we might suspect escapement of cattle and dog as the main reason for impact with these animal on the roads. Appropriate fencing (preventing access of cattle, horses to the roads) as well as good handling of dogs could help decreasing casualties with domestic animals. Although large species are the main reasons for car accident, non-negligible part (7% of total accidents) is due to small species, and this percentage even reaches 17% when including dogs.

In Sweden wildlife-related accidents is suspected to cause an average annual loss of 1–12% of the estimated population of common mammal species (Seiler et al. 2004). On average, for the studied period, the proportion between accidents and hunting bag was 0.5% for wild boar, 0.22% for roe deer and 0.27% for red deer. If we assume hunting bag as an index of population number and the estimation from Seiler et al. (2004) to be similar in Wallonia, we can say that police data for these three species includes between 4–50% for the wild boar, 2–20% for roe deer and 2.5–27% for red deer of the total annual casualties with these wild species.

Temporal patterns

During the study period, the number of WVC has increased constantly and sharply for most of the species, particularly for wild boar and red deer. This annual increases seems to be related topopulation increase if we assume hunting statistics and number of car accidents reflect well animal population size (Inbar et al. 2002). In the case of wild boar the strong correlation between hunting bag and WVC seems however to reflect direct relationship between population density and car-accidents (Rosell et al. 2010).

Monthly distribution of WVC demonstrated effects of breeding, dispersal and external factors on increase of movement and consecutively on risk of accidents. Theseresults are in accordance with Hell et al. (2005) with higher frequency of road kills in spring and summer. In autumn, increase in WVC is likely to denote the impact of hunting activities on movement of game species (Sforzi and Lovari 2000). Among these, wild boar is importantly implied in roads accident during the autumn. This may be related to the effect of hunting activities on the increase movement of wild boar, and consequently the chance of road crossing during this period (Keuling et al. 2008). In Wallonia, driven hunt is the most used hunting practice and this kind of control method can affect greatly wild boar movement (Maillard and Fournier 1995). Autumn peak in red fox is likely to be attributed to dispersal occurring at this period of the year, when sub adults that did not find space in their natal social groups disperse (Rushton et al. 2006), and have higher chance to be killed when crossing roads. Rutting activities during these period also increase movement of males and the risk of WVC (Doncaster and Macdonald 1997). However in urban areas, red fox can develop movement strategies to account for the particularly dense road network (Baker et al. 2007). Peak of WVC for roe deer in Spring can also be related to natal dispersal of subadults (Wahlström and Liberg 1995) and confirmed results obtained in others studies (Lagos et al. 2012; Markolt et al. 2012).

Peak of accident events at dusk and night reflects the nocturnal behaviour of mammals living in human-disturbed areas, forcing them to switch most of their foraging activities during night when risk of being seen or disturbed by human is lowered (Cahill et al. 2003; Danilkin and Hewison 1996; Doncaster and Macdonald 1997). At dusk and dawn car traffic is also higher due to people driving back home from or towards their working place. Visual conditions at these hours are not really good either (darkness, presence of fog) and can also partly explain higher number of accident events. In the middle of the night, number of accidents decreases, resulting of the reduced activity of animal as well as a lowered traffic.

Spatial distribution

Although national and highways account for 14.6% of the total length of the road network in Wallonia, we observed that more than a half of the WVC occur on these roads. This disproportionate number of accidents on major roads is in accordance with results reviewed in Langbein et al. (2011). Difference in traffic volume can explain partly this difference with twice as much traffic volume observed on highways and national roads (15 billion vehicle-kilometer/year) compared to local and regional road system (8.4 billion vehicle-kilometer/year) (SPW 2012). The lower traffic on these local roads is likely to be compensated by higher density of this type of roads, and thus higher number of crossing events of these roads by wild animals.

Spatial analyses of accidents showed that for all species, the distribution along the road network was not random. We indeed observed that WVC were highly clustered along highways and national roads in Wallonia, Southern Belgium. Spatial structure demonstrated a clustered patterns, also observed for roe deer in Denmark (Madsen et al. 2002) and for roe deer and wild boar in Spain (Diaz-Varela et al. 2011).

We decided to concentrate our effort for analyzing spatial structure at various scales by means of the Ripley K and the L-function on a smaller size area because when including the whole network we observed clustering patterns at all scales because the number of WVC was too low regarding the total length of the road network (Langen et al. 2012). This subarea was select based on the result of the kernel density estimation that allows us to select the most suitable area in term of number of accident and road length. We observed peak of clustering at scales ranging from 10km for roe deer to 40km for red fox. In the literature, we did not find results for the same species as we investigated, but the results are in accordance with the moose which has clustering value ranging from 2.5 to 30km (Mountrakis and Gunson 2009) and for a guild of mammalian species in Brazil ranging from 15 to 30km (Coelho et al. 2008).

Kernel density mapping showed areas with higher risk of WVC. Road density and land cover are likely to explain this non-random pattern (Gonser et al. 2009). A more thorough analysis on the factors associated with these areas is currently undergoing and wild help understanding what elements of the landscape and the road characteristics affect the likelihood of accidents with animals. A common belief is that wildlife casualties are likely to occur in highly forested area, but recent papers have demonstrated the role of agricultural land on risk of casualties with deer (Gonser et al. 2009) and wild boar (Colino-Rabanal et al. 2012) particularly. These habitats are indeed particularly interesting for both species, providing both cover and food resources.

Mitigation measures

The Wallonian road network is almost completely developed since decades now. Implementing wildlife passage on already built highways is more expensive than when it is included from the beginning in road construction plan. However mitigation measures should locally be set up in most risky areas to decrease the number of casualties. Indeed, as we have seen, accidents with wild mammals show strong temporal and spatial patterns, and the peaks identified could help to set up measures that increase the awareness of drivers during more sensible period of the year or the day. Informative signs on potential animal crossing along the road have been demonstrated to increase the alertness of drivers (Stout et al. 1993) and to decrease the car speed which positively affect number of collisions (Sullivan et al. 2004). Signs however are also known to be often ignored by drivers. In Belgium, crossing signs already exist on most of the road network. We aim in further analysis to put in relation the distribution of the signs with the areas of high concentration of accidents (“hotspots”), to see if they overlap well (Krisp and Durot 2007). Most of these signs have been installed in potential risky areas but the accuracy of their positioning (regarding WVC hotspots) has never been controlled so far. Now with the northern expansion of wild boar an update of the caution signs should be carried out on the Belgium road network. It seems thus urgent to propose localised measures during some period of the year/day to prevent casualties, by lowering speed limitation in these riskier areas and focusing on an adapted management plan (increase culling) in the neighborhood of these road segments. This last measure could also be temporally counterproductive, hunting activities being known to increase animal movement and thus risk of crossing roads (Keuling et al. 2008; McIlroy and Saillard 1989). However we think that, applied with caution, management of species causing problem is an unavoidable task to include in a mitigation plan.

Next to roadkills, road network have others negative effects on large mammals. They can indeed act as barriers for animal movement, subdividing species into subpopulation, although this might depend of the effect of the road type and the species. Hence, in Belgium a recent study by Frantz et al. (2012) showed how highways might impact differently wild boar and red deer, this latter being affected more by the barrier effect of roads. Transport planning should thus do something for mitigate effect on red deer as probably building up passage over main identified crossing points.

Conclusion

Our study is the first to bring results in Wallonia about WVC. We brought insights into species involved and in the spatio-temporal patterns of these accidents. Wild boar and roe deer constitute the major part of the accidents. Temporal analysis showed the role of animal biology in explaining monthly and daily patterns of WVC occurrences. Multi-scale spatial analysis demonstrated the clustering patterns of accidents in Wallonia for the main game species. These results highlight the need to take both spatial and temporal components into account for building predictive model. The next step of our research will indeed be dedicated to joining the results of this research together with landscape and road factors to build a predictive model of WVC hotspots and to propose mitigation strategies that could enhance both human and animal safety. GPS data collected on wild boar and red deer will be used to determine the road effect for these two species behaviour. This will bring us new understanding on the real effect of road network on animal behaviour. However many WVC are still not reported, because of the absence of police statement, but would be required to measure more precisely long–term effects of roads on main game species. We thus hope these first results will be helpful in convincing stakeholders (police, local authorities, insurance companies, forest administration, naturalists, drivers) to collaborate so that better data collection could be achieved in the near future.

Acknowledgements

This research was partially supported by the Fonds pour la Formation à la Recherche dans l’Industrie et l’Agronomie (FNRS-FRIA, Belgium). We are grateful to the different Court of Justice that authorized us to access the statements involving free-ranging animals. We also would like to thank Belgian Federal Police and every Local Police Zone for their participation in the collection of the data. Thanks to Coralie Mengal for the management of the database. We also wish to thank two anonymous native speakers for improving the English grammar of the text.

References
Bailey TC, Gatrell AC (1995) Interactive Spatial Data Analysis. Longman Scientific & Technical; J Wiley, Harlow Essex, England, 413 pp.
Baker PJ, Dowding CV, Molony SE, White PCL, Harris S (2007) Activity patterns of urban red foxes (Vulpes vulpes) reduce the risk of traffic-induced mortality. Behavioral Ecology 18: 716-724. doi: 10.1093/beheco/arm035
Baker PJ, Harris S, Robertson CPJ, Saunders G, White PCL (2004) Is it possible to monitor mammal population changes from counts of road traffic casualties? An analysis using Bristol’s red foxes Vulpes vulpes as an example. Mammal Review 34: 115-130. doi: 10.1046/j.0305-1838.2003.00024.x
Balčiauskas L, Balčiauskienė L (2008) Wildlife-vehicle accidents in Lithuania, 2002–2007. Acta Biol Univ Daugavp 8: 89-94.
Barthelmess E, Brooks M (2010) The influence of body-size and diet on road-kill trends in mammals. Biodiversity and Conservation 19: 1611-1629. doi: 10.1007/s10531-010-9791-3
Bissonette JA, Adair W (2008) Restoring habitat permeability to roaded landscapes with isometrically-scaled wildlife crossings. Biological Conservation 141: 482-488. doi: 10.1016/j.biocon.2007.10.019
Burbaitė L, Csányi S (2010) Red deer population and harvest changes in Europe. Acta Zoologica Lituanica 20: 179-188. doi: 10.2478/v10043-010-0038-z
Cahill S, Llimona F, Gràcia J (2003) Spacing and nocturnal activity of wild boar Sus scrofa in a Mediterranean metropolitan park. Wildlife Biology 9: 3-13.
Clark PJ, Evans FC (1954) Distance to Nearest Neighbor as a Measure of Spatial Relationships in Populations. Ecology 35: 445-453. doi: 10.2307/1931034
Clevenger AP, Chruszcz B, Gunson KE (2003) Spatial patterns and factors influencing small vertebrate fauna road-kill aggregations. Biological Conservation 109: 15-26. doi: 10.1016/S0006-3207(02)00127-1
Coelho I, Kindel A, Coelho A (2008) Roadkills of vertebrate species on two highways through the Atlantic Forest Biosphere Reserve, southern Brazil. European Journal of Wildlife Research 54: 689-699. doi: 10.1007/s10344-008-0197-4
Colino–Rabanal VJ, Bosch J, Muñoz MJ, Peris SJ (2012) Influence of new irrigated croplands on wild boar (Sus scrofa) road kills in NW Spain. Animal Biodiversity and Conservation 35: 247-252.
Conover M, Pitt W, Kessler K, DuBow T, Sanborn W (1995) Review of Human Injuries, Illnesses, and Economic Losses Caused by Wildlife in the United States. Wildlife Society Bulletin 23: 407–414. doi: http://www.jstor.org/stable/3782947
Conruyt-Rogeon G, Girardet X (2012) Identification des points de conflits entre la faune et les routes. Méthode d’observation des collisions par les agents des routes. Retour d’expérience sur le réseau de la DIR Est en Franche-Comté. Direction de la Recherche, de l’Expertise et de la Valorisation, Service du Patrimoine Naturel, Direction Déléguée au Développement Durable, à la Conservation de la Nature et à l’Expertise, 75 pp.
Cserkész T, Ottlecz B, Cserkész-Nagy Á, Farkas J (2013) Interchange as the main factor determining wildlife–vehicle collision hotspots on the fenced highways: spatial analysis and applications. European Journal of Wildlife Research 59: 587-597. doi: 10.1007/s10344-013-0710-2
Damarad T, Bekker GJ (2003) COST 341- Habitat Fragmentation due to Transportation Infrastructure: Findings of the COST Action 341. Office for official publications of the European Communities, Luxembourg.
Danilkin A, Hewison AJM (1996) Behavioural Ecology of Siberian and European Roe Deer. Springer, 278 pp.
Danks ZD, Porter WF (2010) Temporal, Spatial, and Landscape Habitat Characteristics of Moose - Vehicle Collisions in Western Maine. The Journal of Wildlife Management 74: 1229–1241. doi: 10.1111/j.1937-2817.2010.tb01243.x
Diaz-Varela ER, Vazquez-Gonzalez I, Marey-Pérez MF, Álvarez-López CJ (2011) Assessing methods of mitigating wildlife–vehicle collisions by accident characterization and spatial analysis. Transportation Research Part D: Transport and Environment 16: 281-287. doi: 10.1016/j.trd.2011.01.002
Doncaster CP, Macdonald DW (1997) Activity patterns and interactions of red foxes (Vulpes vulpes) in Oxford city. Journal of Zoology 241: 73-7. doi: 10.1111/j.1469-7998.1997.tb05500.x
Ford AT, Fahrig L (2007) Diet and body size of North American mammal road mortalities. Transportation Research Part D 12: 498-505. doi: 10.1016/j.trd.2007.07.002
Forman RTT, Alexander LE (1998) Roads and their major ecological effects. Annual Review of Ecology and Systematics 29: 207-231. doi: 10.1146/annurev.ecolsys.29.1.207
Frantz AC, Bertouille S, Eloy MC, Licoppe A, Chaumont F, Flamand MC (2012) Comparative landscape genetic analyses show a Belgian motorway to be a gene flow barrier for red deer (Cervus elaphus), but not wild boars (Sus scrofa). Molecular Ecology 21: 3445-3457. doi: 10.1111/j.1365-294X.2012.05623.x
Gonser RA, Jensen RR, Wolf SE (2009) The spatial ecology of deer–vehicle collisions. Applied Geography 29: 527-532. doi: 10.1016/j.apgeog.2008.11.005
Gosselink TE, Van Deelen TR, Warner RE, Mankin PC (2007) Survival and Cause-Specific Mortality of Red Foxes in Agricultural and Urban Areas of Illinois. Journal of Wildlife Management 71: 1862-1873. doi: 10.2193/2006-020
Greenwood PE, Nikulin MS (1996) A Guide to Chi-Squared Testing. Wiley, 432 pp.
Groot Bruinderink GWTA, Hazebroek E (1996) Ungulate Traffic Collisions in Europe Colisiones de Trápico con Ungulados en Europa. Conservation Biology 10: 1059-1067. doi: 10.1046/j.1523-1739.1996.10041059.x
Gunson KE, Mountrakis G, Quackenbush LJ (2011) Spatial wildlife-vehicle collision models: a review of current work and its application to transportation mitigation projects. Journal of Environmental Management 92: 1074-1082. doi: 10.1016/j.jenvman.2010.11.027
Haigh AJ (2012) Annual patterns of mammalian mortality on Irish roads. Hystryx, the Italian Journal of Mammalogy 23: 58-66. doi: 10.4404/hystrix-23.2-4747
Hell P, Plavý R, Slamečka J, Gašparík J (2005) Losses of mammals (Mammalia) and birds (Aves) on roads in the Slovak part of the Danube Basin. European Journal of Wildlife Research 51: 35-40. doi: 10.1007/s10344-004-0068-6
Holsbeek L, Rodts J, Muyldermans S (1999) Hedgehog and other animal traffic victims in Belgium: results of a countryside survey. Lutra 42: 111-119.
Huijser MP, Bergers PJM (2000) The effect of roads and traffic on hedgehog (Erinaceus europaeus) populations. Biological Conservation 95: 111-116. doi: 10.1016/S0006-3207(00)00006-9
Inbar M, Shanas U, Izhaki I (2002) Characterization of road accidents in Israel involving large mammals. Israel Journal of Zoology 48: 197-206. doi: 10.1560/XGJB-VR67-RFEQ-N27A
Jenks GF, Caspall FC (1971) Error on choroplethic maps: definition, measurement, reduction. Annals of The Association of American Geographers 61: 217-244. doi: 10.1111/j.1467-8306.1971.tb00779.x
Keuling O, Stier N, Roth M (2008) How does hunting influence activity and spatial usage in wild boar Sus scrofa L.? European Journal of Wildlife Research 54: 729-737. doi: 10.1007/s10344-008-0204-9
Knapp KK (2005) Crash reduction factors for deer-vehicle crash countermeasures: State of the knowledge and suggested safety research needs. In: Statistical Methods; Highway Safety Data, Analysis, and Evaluation; Occupant Protection; Systematic Reviews and Meta-Analysis. Transportation Research Board 1908: 172-179.
Kramer-Schadt S, Revilla E, Wiegand T, Breitenmoser URS (2004) Fragmented landscapes, road mortality and patch connectivity: modelling influences on the dispersal of Eurasian lynx. Journal of Applied Ecology 41: 711-723. doi: 10.1111/j.0021-8901.2004.00933.x
Krisp JM, Durot S (2007) Segmentation of lines based on point densities—An optimisation of wildlife warning sign placement in southern Finland. Accident Analysis & Prevention 39: 38-46. doi: 10.1016/j.aap.2006.06.002
Lagos L, Picos J, Valero E (2012) Temporal pattern of wild ungulate-related traffic accidents in northwest Spain. European Journal of Wildlife Research 58: 661-668.
Langbein J, Putman R, Pokorny B (2011) Traffic collisions involving deer and other ungulates in Europe and available measures for mitigation. In: Press CU (Ed) Ungulate Management in Europe: Problems and Practices. Cambridge University Press, 410 pp. doi: 10.1017/CBO9780511974137.009
Langen T, Gunson K, Scheiner C, Boulerice J (2012) Road mortality in freshwater turtles: identifying causes of spatial patterns to optimize road planning and mitigation. Biodiversity and Conservation 21: 3017-3034. doi: 10.1007/s10531-012-0352-9
Lodé T (2000) Effect of a motorway on mortality and isolation of wildlife populations. Ambio 29: 163-166.
Madsen AB, Strandgaard H, Prang A (2002) Factors causing traffic killings of roe deer Capreolus capreolus in Denmark. Wildlife Biology 8: 55-61.
Maillard D, Fournier P (1995) Effects of shootings with hounds on home range size of wild boar (Sus scrofa L.) groups in mediterranean habitat. IBEX Journal of Mountain Ecology 3: 102-107.
Markolt F, Szemethy L, Lehoczki R, Heltai M (2012) Spatial and temporal evaluation of wildlife-vehicle collisions along the M3 Highway in Hungary. North-Western Journal of Zoology 8: 414-425.
McIlroy JC, Saillard RJ (1989) The effect of hunting with dogs on the numbers and movements of feral pigs, Sus scrofa, and the subsequent success of poisoning exercises in Namadgi National Park, ACT. Australian Wildlife Research 16: 353-363. doi: 10.1071/WR9890353
Milner JM, Bonenfant C, Mysterud A, Gaillard JM, Csanyi S, Stenseth NC (2006) Temporal and spatial development of red deer harvesting in Europe: biological and cultural factors. Journal of Applied Ecology 43: 721-734. doi: 10.1111/j.1365-2664.2006.01183.x
Mountrakis G, Gunson K (2009) Multi-scale spatiotemporal analyses of moose–vehicle collisions: a case study in northern Vermont. International Journal of Geographical Information Science 23: 1389-1412. doi: 10.1080/13658810802406132
Neumann W, Ericsson G, Dettki H, Bunnefeld N, Keuler NS, Helmers DP, Radeloff VC (2012) Difference in spatiotemporal patterns of wildlife road-crossings and wildlife-vehicle collisions. Biological Conservation 145: 70-78. doi: 10.1016/j.biocon.2011.10.011
Okabe A, Okunuki K-i, Shiode S (2006) SANET: A Toolbox for Spatial Analysis on a Network. Geographical Analysis 38: 57-66. doi: 10.1111/j.0016-7363.2005.00674.x
Okabe A, Okunuki K, Shiode, S (2013) SANET: A Toolbox for Spatial Analysis on a Network. The manual for SANET V4.1 Beta runs on ArcGIS10 & ArcGIS10.1. http://sanet.csis.u-tokyo.ac.jp/download/manual_ver4.pdf
Okabe A, Satoh T, Sugihara K (2009) A kernel density estimation method for networks, its computational method and a GIS-based tool. International Journal of Geographical Information Science 23: 7-32. doi: 10.1080/13658810802475491
Okabe A, Yamada I (2001) The K-Function Method on a Network and Its Computational Implementation. Geographical Analysis 33: 271-290. doi: 10.1111/j.1538-4632.2001.tb00448.x
Putman RJ (1997) Deer and Road Traffic Accidents: Options for Management. Journal of Environmental Management 51: 43–57. doi: 10.1006/jema.1997.0135
Ripley BD (1976) The Second-Order Analysis of Stationary Point Processes. Journal of Applied Probability 13: 255-266. doi: 10.2307/3212829
Rodríguez-Morales B, Díaz-Varela ER, Marey-Pérez MF (2013) Spatiotemporal analysis of vehicle collisions involving wild boar and roe deer in nw spain. Accident Analysis & Prevention 60: 121-133. doi: 10.1016/j.aap.2013.07.032
Roedenbeck IA, Fahrig L, Findlay CS, Houlahan JE, Jaeger JAG, Klar N, Kramer-Schadt S, van der Grift EA (2007) The Rauischholzhausen Agenda for Road Ecology. Ecology and Society 12: 11.
Romin LA, Bissonette JA (1996) Deer–vehicle collisions: status of state monitoring activities and mitigation efforts. Wildlife Society Bulletin 24: 276-283.
Rosell C, Navas F, Pou MF, Carol J (2010) Wild boar vehicle collisions. Spatial and temporal patterns and measures for the mitigation of the conflict. In: 8th International Symposium on Wild Boar and other Suids. Sopron, Hungary, 91–93 pp.
Rushton SP, Shirley MDF, MacDonald DW, Reynolds JC (2006) Effects of Culling Fox Populations at the Landscape Scale: A Spatially Explicit Population Modeling Approach. The Journal of Wildlife Management 70: 1102-1110. doi: 10.2193/0022-541X(2006)70[1102:EOCFPA]2.0.CO;2
Saez-Royuela C, Telleria JL (1986) The increased population of the wild boar (Sus scrofa L.) in Europe. Mammal Review 16: 97-101. doi: 10.1111/j.1365-2907.1986.tb00027.x
SANET. A Spatial Analysis along Networks (Ver. 4.1). Atsu Okabe, Kei-ichi Okunuki and SANET Team, Tokyo, Japan.
Seiler A (2004) Trends and spatial patterns in ungulate–vehicle collisions in Sweden. Wildlife Biology 10: 301-313.
Seiler S, Helldin J-O, Seiler C (2004) Road mortality in Swedish mammals: results of a drivers’ questionnaire. Wildlife Biology 10: 225-233.
Sforzi A, Lovari S (2000) Some effects of hunting on wild mammalian populations. IBEX JME 5: 165-171.
Shepard DB, Kuhns AR, Dreslik MJ, Phillips CA (2008) Roads as barriers to animal movement in fragmented landscapes. Animal Conservation 11: 288-296. doi: 10.1111/j.1469-1795.2008.00183.x
SPW (2012) Les Indicateurs Clés de l’Environnement Wallon. Direction de l’Etat Environnemental. Service public de Wallonie - DGARNE - DEMNA - DEE, 160 pp.
Stout RJ, Stedman RC, Decker DJ, Knuth BA (1993) Perceptions of Risk from Deer-Related Vehicle Accidents: Implications for Public Preferences for Deer Herd Size. Wildlife Society Bulletin 21: 237-249.
Sullivan TL, Williams AE, Messmer TA, Hellinga LA, Kyrychenko SY (2004) Effectiveness of temporary warning signs in reducing deer vehicle collisions during mule deer migrations. Wildlife Society Bulletin 32: 907-915. doi: 10.2193/0091-7648(2004)032[0907:EOTWSI]2.0.CO;2
Tajchman K, Gawryluk A, Drozd L (2010) Effects of roads on populations of wild game in the Lublin region. Teka Kom Ochr Kszt Środ Przyr – OL PAN 7: 420-427.
van der Ree R, Jaeger JAG, van der Grift EA, Clevenger AP (2011) Effects of Roads and Traffic on Wildlife Populations and Landscape Function: Road Ecology is Moving toward Larger Scales. Ecology and Society 16.
Vignon V, Barbarreau H (2008) Collisions entre véhicules et ongulés sauvages: quel coût économique? Faune Sauvage 279: 31–35.
Wahlström LK, Liberg O (1995) Patterns of dispersal and seasonal migration in roe deer (Capreolus capreolus). Journal of Zoology 235: 455-467. doi: 10.1111/j.1469-7998.1995.tb01762.x
Williams AF, Wells JK (2005) Characteristics of vehicle-animal crashes in which vehicle occupants are killed. Traffic Inj Prev 6: 56-59.