


Citation: Kahl T, Bauhus J (2014) An index of forest management intensity based on assessment of harvested tree volume, tree species composition and dead wood origin. Nature Conservation 7: 15–27. doi: 10.3897/natureconservation.7.7281
Forest management intensity often affects biodiversity, ecosystem processes and ecosystem services. To assess the influence of past management intensity on current ecosystem properties, management intensity must be quantified in a meaningful and reproducible approach. Here we developed the simple yet effective Forest Management Intensity index (ForMI), which is based only on inventory data of the living stand, stumps and dead wood. The ForMI is the sum of three components taking into account: 1. the proportion of harvested tree volume (Iharv), 2. the proportion of tree species that are not part of the natural forest community (Inonat) and 3. the proportion of dead wood showing signs of saw cuts (Idwcut). Each component ranges between 0 (no sign of management) and 1 (intensive management). Our analysis suggests that the ForMI can be used to assess management intensity in Central European forests for the last 30 to 40 years, depending on decay rates of stumps and dead wood. Our approach was tested using data of 148 forest plots of 1 ha in size in Germany. We found a significant distinction between plots that were previously described as managed and unmanaged as well as between plots comprising trees species of the natural forest community and those with additional, introduced coniferous tree species. We conclude that the index is applicable to a wide range of forest management types, but should not be misinterpreted as an index for old-growth structure.
Land-use intensity, Biodiversity exploratories
Forest management intensity is suggested to be a main driver of biodiversity, ecosystem processes and ecosystem services (
One core activity of forest management consists of the harvest of living trees. There are a variety of silvicultural approaches leading to even-aged forest stands characterized by distinct age-classes or uneven-aged forest stands resulting from selection cutting. Despite the large differences between those silvicultural approaches the result is always the removal of wood. Unfortunately, the records about the amount of wood volume removed are often not specific at the stand level but are documented for compartments or management units, and not all assortments may be traced; e.g. firewood may not be recorded. However, tree removals are traceable by tree stumps left after cutting. To gain a relative measure of the amount of harvested tree volume, the difference between the observed standing volume to the maximum volume based on the self-thinning relationship for a particular age and tree species (
In addition to harvesting, the composition of tree species is one of the main factors influenced by forest management. Although preindustrial forest management and land use change may have altered the natural tree species composition already, there is no doubt that the shift in tree species composition following the early industrial period towards secondary forests comprising coniferous species (Picea abies, Pinus sylvestris) in Central Europe has had a profound influence on forest ecosystems (
Since in actively managed forests, wood is regularly removed, both the quantity and quality of dead wood are substantially altered when compared to unmanaged forests (
In the following, we present the definition of the proposed ForMI and show an application to a set of 148 forest plots as well as a comparison with two other indices that have been calculated for the same plots.
The first component of the index Iharv describes the proportion of harvested tree volume. Our approach is based on the assumption that the sum of the living standing tree biomass (1), harvested tree biomass removed from the stand (including the logging waste in the stand) (2), and the dead wood biomass of trees that died naturally (no chain saw cuts) (3) can be used as a proxy for the potential cumulative merchantable volume (
The main drawback of this approach is the uncertainty about the time until the stumps and dead wood are decayed. The decay rate of stumps depends mainly on tree species, site conditions and size (
Although stump turnover time maybe highly variable, this approach has the advantage that the influence of tree harvest recognisable as stumps virtually decays with time. Harvesting events that occurred recently can be fully considered, whereas harvesting events that date further back will have increasingly less influence on this measure, which presumably also reflects a decreasing legacy influence. The harvested tree volume determined in this way is certainly less accurate than could be derived from repeated inventory or detailed, stand-based harvesting records, however, in most cases these do not exist. So the sum of harvested volume, dead wood volume and the living volume provides the proxy for the potential cumulative merchantable volume of the last 30–40 years.
The Iharv is calculated as the ratio of harvested volume to the sum of standing, harvested and dead wood volume. A value of 1 represents a clear-cut site, where tree regeneration has not yet reached the minimum tree diameter limit used for inventory purpose and no dead wood occurs, and a ratio of 0 means that no tree harvest occurred within the last 30–40 years. The index Iharv can only be applied, where conventional forest management using chain saws or a harvester leaves stumps. In general it can be said that all parameters (e.g. tree species, size, climate) that increase stump turnover time will also increase the component Iharv.
The component Inonat is a measure for the volume proportion of non-natural tree species. It is estimated as the proportion of harvested, living and dead wood (without saw cuts) volume of non-natural tree species to the sum of harvested, living and dead wood (without saw cuts) volume of all tree species. Again here, the legacy of former stand conditions (e.g. a cohort of introduced spruce trees that were harvested within a time frame of 30–40 years prior to assessment of forest management intensity in a forest composed now entirely of tree species belonging to the natural forest vegetation) is taken into account. A value of 1 means that the whole stand consists of non-natural tree species, whereas a value of 0 is a stand composed of tree species belonging to the natural forest vegetation only.
The component Idwcut represents the proportion of dead wood volume with saw cuts to the total amount of dead wood volume. A value of 1 means that all dead wood originated from management activity (wood residue) or that trees that died by natural causes were cut and used, while a value of 0 means that all dead wood is a result of natural tree death. In case where no dead wood occurs but clear signs of management are visible e.g. due to fuel sampling or in plantation forests with whole tree harvesting we recommend to adjust the Idwcut to a value of 1.
The forest management index ForMI is the sum of all three components Iharv, Inonat and Idwcut. Although the relative importance of each component as an indicator of forest management intensity is debatable, we decided to weigh each component by a value of 1. For example, a ForMI of 3 would apply to a clear-cut stand of non-natural tree species, where no dead wood of natural origin occurs. A value of 0 would apply to a stand, where no stumps were found, only natural tree species and only dead wood without saw cuts occur. The ForMI describes strictly past management intensity and does not aim to describe forest structure or level of oldgrowthness (c.f.
To test our approach, we used inventory data of the 150 forest experimental plots of the German Biodiversity Exploratories (
The ForMI provided a clear distinction between managed and unmanaged forests (Wilcox Test p<0.001) (Fig. 1). The main difference between managed and unmanaged forests was caused by the low number of stumps and the low amount of dead wood with saw cuts in unmanaged forests. Four out of 21 unmanaged stands had a ForMI of 0, which suggests that they have been unmanaged for at least 30-40 years. This result is congruent with other information about these unmanaged forest plots (
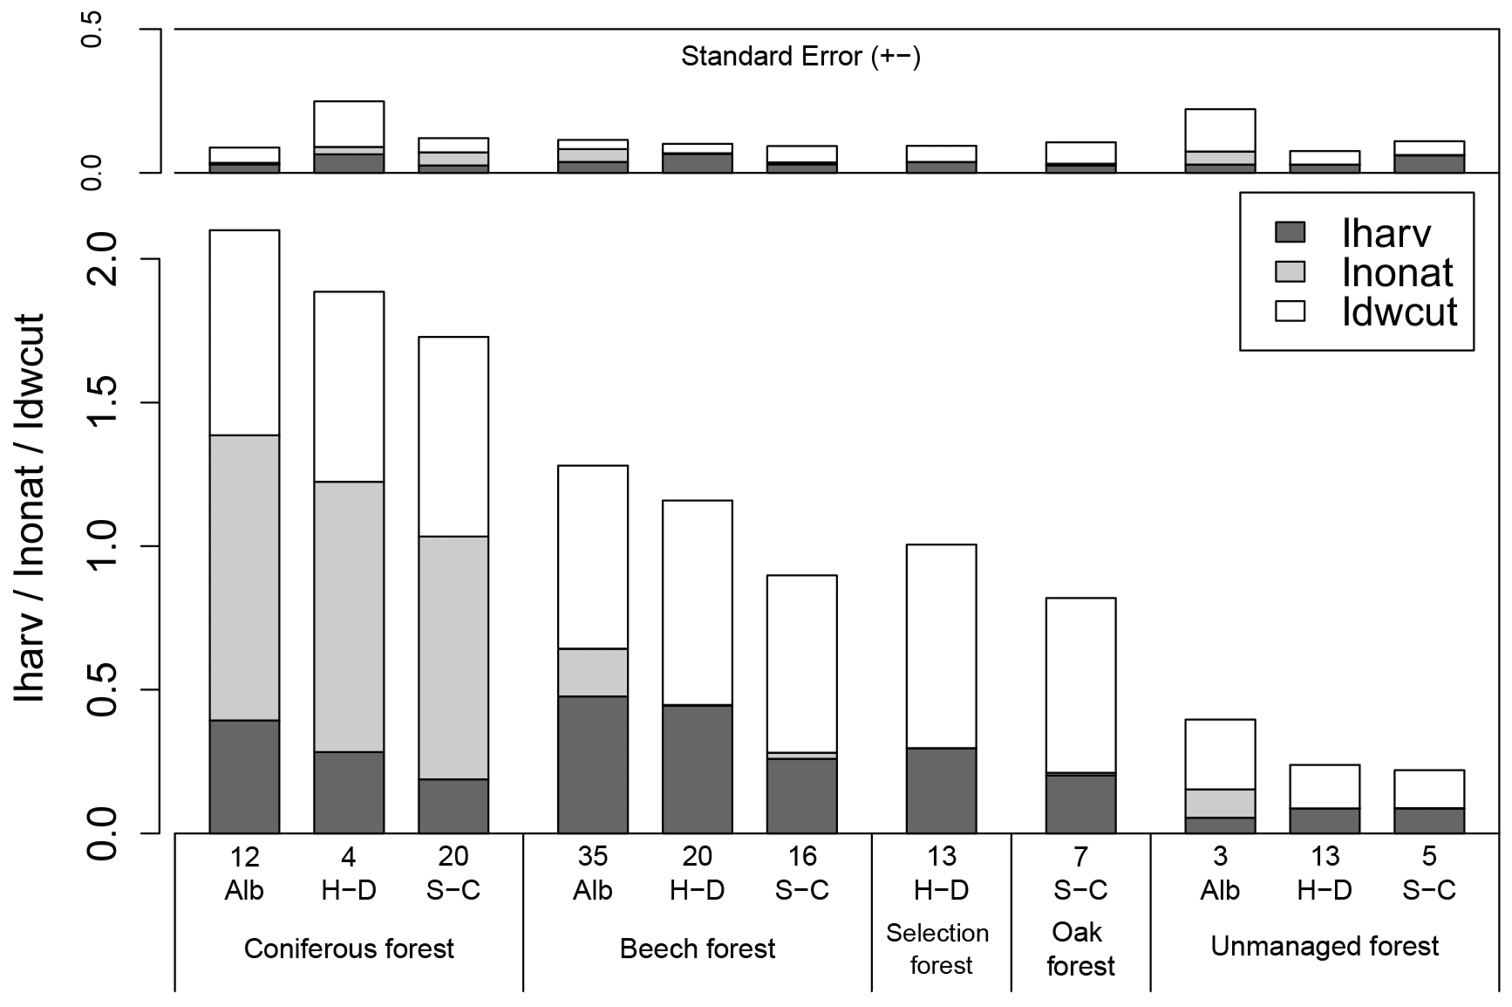
Distribution of the forest management intensity index ForMI and its 3 components across 5 different forest management types in the Biodiversity exploratories Schwäbische Alb (Alb), Hainich-Dün (H-D) and Schorfheide-Chorin (S-C). Numbers below the bars indicate the number of plots per group. The second bar plot above shows the standard error for each component. In the exploratories Alb and H-D, coniferous forest comprises even-aged Picea abies stands, and in the S-C exploratory Pinus sylvestris age class forest. Beech forest in all exploratories refers to even-aged Fagus sylvatica stands. Selection forest in the H-D exploratory is uneven-aged selection cutting stands dominated by Fagus sylvatica. Oak forest in the S-C exploratory is even-aged Quercus spec. forest. Unmanaged forest in the Alb exploratory represents extensively managed Fagus sylvatica forest, in the H-D and S-C it has been unmanaged for 10–60 years.
The ForMI as well as its three components cover the whole range of values across the 148 experimental plots (Fig. 2). The distribution of Iharv is right-skewed indicating that only few plots experienced rather intensive recent harvest. The distribution of Inonat shows a bimodal shape with two maxima, one at 0 (only natural tree species), reflecting the dominance of beech plots among the exploratories, and one at 1 (only non-natural tree species) and only few stands, where these two tree species groups occur together. Idwcut shows a left-skewed distribution indicating that in most stands dead wood has been created by harvesting activities. The distribution of ForMI is slightly right-skewed and peaks at a value of 1. No relationship between Iharv and Inonat was found while there were significant positive, but not strong relationships between Idwcut and Iharv and between Idwcut and Inonat (Fig. 3)
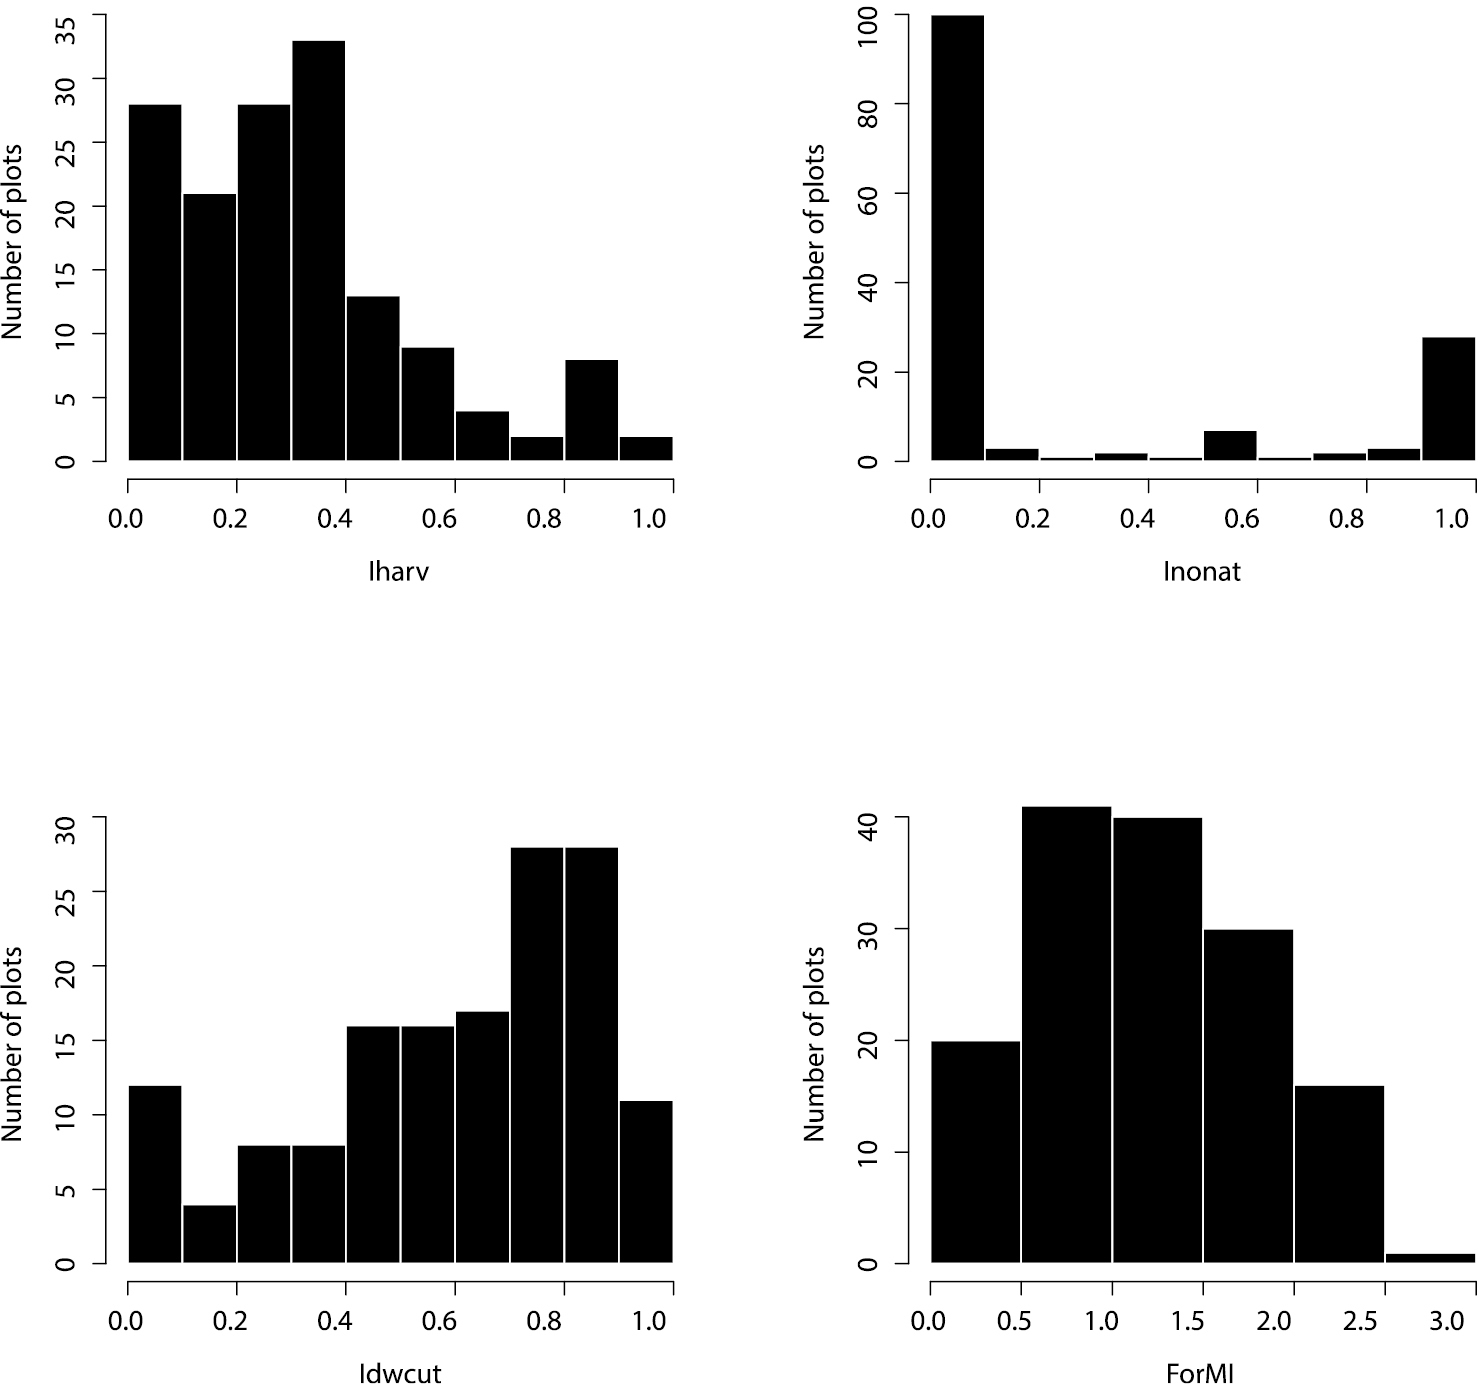
Distribution of the forest management intensity components: Iharv - proportion of harvested volume; Inonat – proportion of non-natural tree species; Idwcut – proportion of dead wood volume with saw cuts; and of the combined ForMI – forest management intensity index. Total number of forest plots is 148.
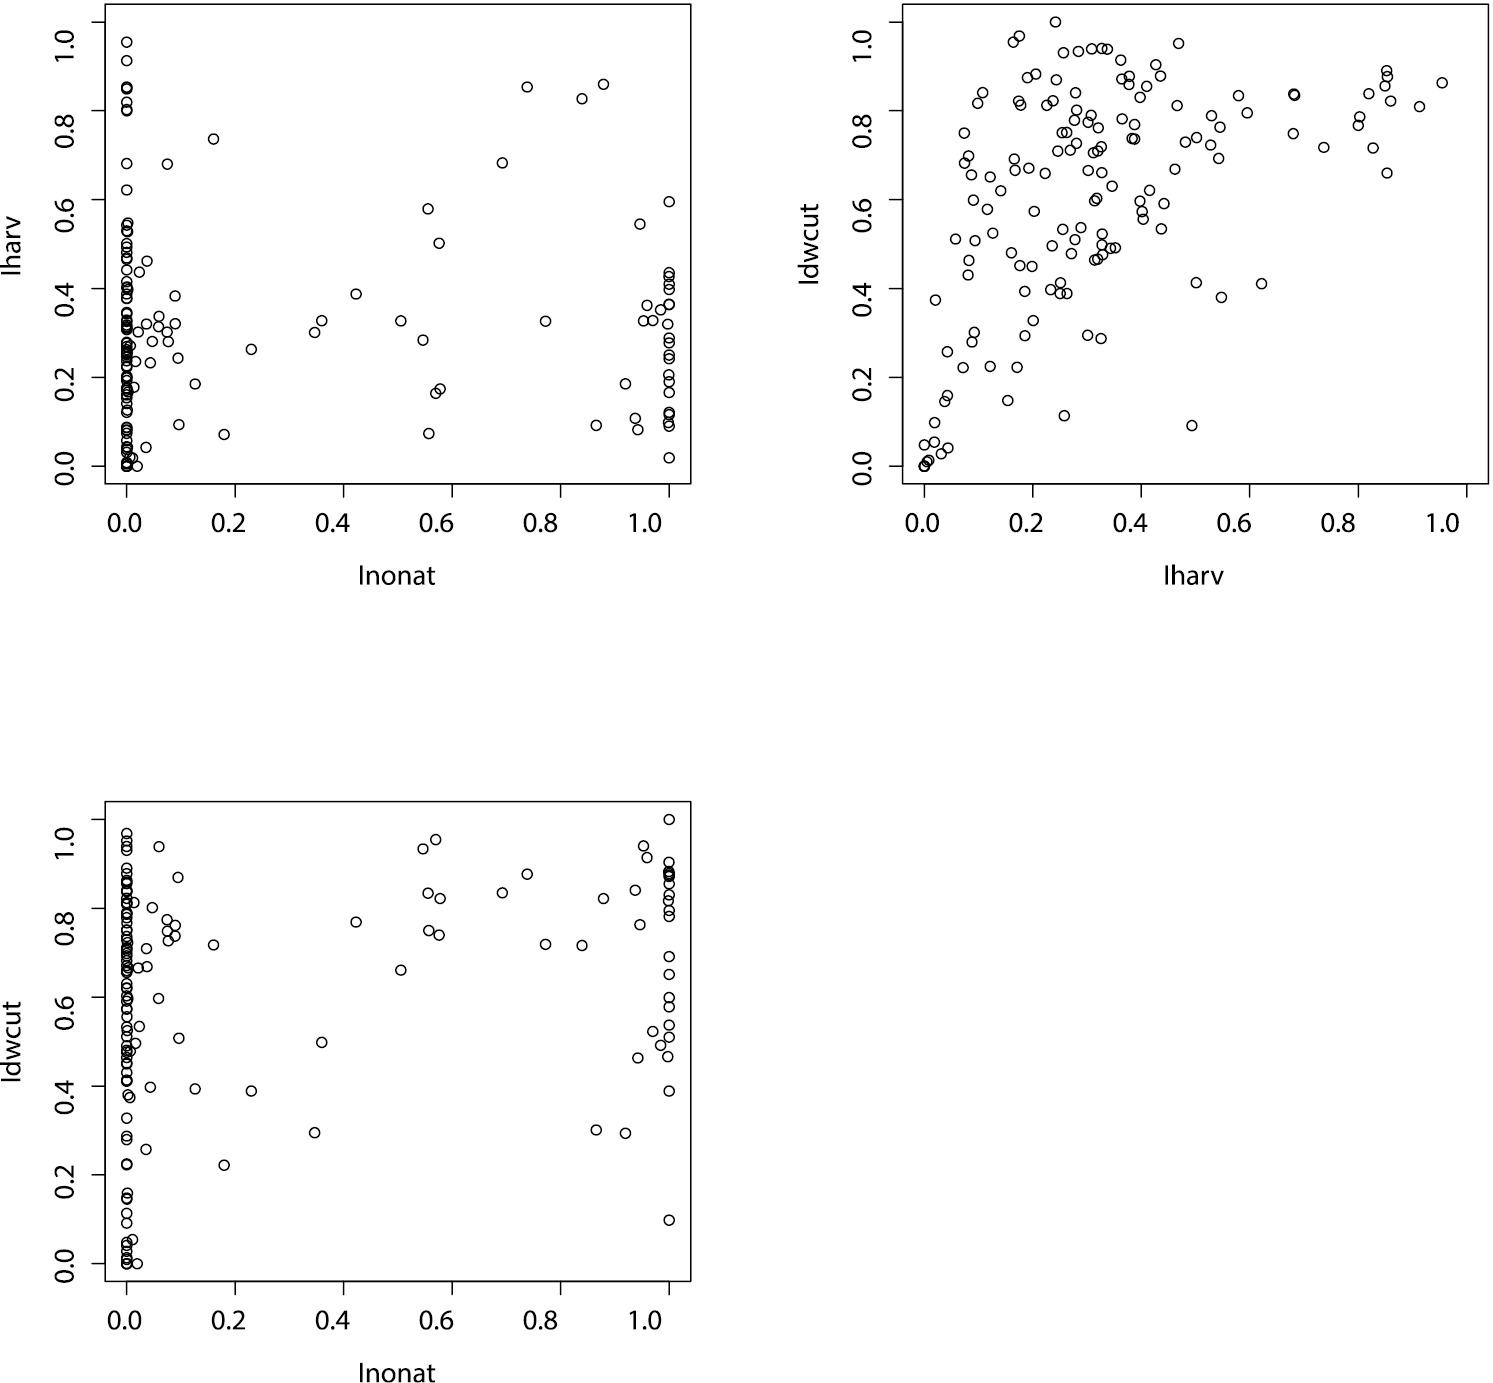
Relationships between the three components of the forest management intensity: Iharv, Inonat and Idwcut. Spearman rank correlation between Iharv-Inonat (p=0.64, rs=0.04), Idwcut-Iharv (p<0.001, rs=0.5) and Idwcut-Inonat (p=0.01, rs=0.21)
The advantage of the ForMi is its simple yet effective approach, which allows the calculation based only on volume or basal area inventory data of the living stand, stumps, and dead wood. No additional assumptions and models with regard to maximum stand carrying capacity or risk potential have to be employed. The ForMI approach proved to be applicable to all observed silvicultural management systems and allows their direct comparison. Although we have not examined yet how different silvicultural management systems, such as clear-cutting or coppice with standards, or large-scale disturbances, such as storm damage or fire, may affect ForMI, we believe that this index is applicable across the whole range of forest management types, except when trees are harvested including their root stock. The disadvantage of the ForMI is that the assessment of harvesting intensity depends on the visibility and longevity of stumps, and that it does not take into account the management frequency and is therefore not useful to describe situations where management occurs in long time intervals that exceed the longevity of stumps, as may be the case in tropical lowland rainforests.
We thank the managers of the three exploratories, Swen Renner, Sonja Gockel, Kerstin Wiesner, and Martin Gorke for their work in maintaining the plot and project infrastructure; Simone Pfeiffer and Christiane Fischer giving support through the central office, Michael Owonibi for managing the central data base, and Markus Fischer, Eduard Linsenmair, Dominik Hessenmöller, Jens Nieschulze, Daniel Prati, Ingo Schöning, François Buscot, Ernst-Detlef Schulze, Wolfgang W. Weisser and the late Elisabeth Kalko for their role in setting up the Biodiversity Exploratories project. The work has been funded by the DFG Priority Program 1374 „Infrastructure-Biodiversity-Exploratories“ (BA 2821/9-2). Field work permits were issued by the responsible state environmental offices of Baden-Württemberg, Thüringen, and Brandenburg (according to § 72 BbgNatSchG). We thank Peter Mühlhäuser, Sandor Haller and Martin Nitsche for conducting the dead wood inventory and Peter Schall and one anonymous reviewer from Peerage of Science for their critical and helpful comments on a previous version of the manuscript.