Research Article |
|
Corresponding author: Monica Dumitraşcu ( stefania_dumitrascu@yahoo.com ) Academic editor: Maurizio Pinna
© 2018 Gheorghe Kucsicsa, Ines Grigorescu, Monica Dumitraşcu, Mihai Doroftei, Mihaela Năstase, Gabriel Herlo.
This is an open access article distributed under the terms of the Creative Commons Attribution License (CC BY 4.0), which permits unrestricted use, distribution, and reproduction in any medium, provided the original author and source are credited.
Citation:
Kucsicsa G, Grigorescu I, Dumitraşcu M, Doroftei M, Năstase M, Herlo G (2018) Assessing the potential distribution of invasive alien species Amorpha fruticosa (Mill.) in the Mureş Floodplain Natural Park (Romania) using GIS and logistic regression. Nature Conservation 30: 41-67. https://doi.org/10.3897/natureconservation.30.27627
|
Abstract
The assessment of invasive terrestrial plant species in the Romanian protected areas is an important research direction, especially since the adventive species have become biological hazards with significant impacts on biodiversity. Due to limited resources being available for the control of the invasive plants, the modelling of the spatial potential distribution is particularly useful in order to find the best measures to eliminate them or prevent their introduction and spread, as well as including them in the management plans of protected areas. Thus, the present paper aims to assess one of the most disturbing invasive terrestrial plant species in Europe – A. fruticosa in one of the most important natural protected area in Romania, i.e. Mureş Floodplain Natural Park (V IUCN category and RAMSAR –Wetlands of International Importance). The current study is a geographical approach seeking to explain the spatial relationships between this invasive species and several explanatory factors (soil type, depth to water, vegetation cover, forest fragmentation and distance to near waters, roads and settlements) and to assess its potential distribution by integrating GIS and logistic regression into spatial simulation. The resultant probability map can be used by the park’s administration in implementing the Management Plan in terms of identifying the areas with the highest occurrence potential of A. fruticosa according to the primary habitats and ecosystems and setting up actions for its eradication/limitation.
Keywords
A. fruticosa (Mill.), spatial assessment, GIS, logistic regression, Mureş Floodplain Natural Park, Romania
Introduction
Invasive species are acknowledged as economic, environmental or social threats (
A. fruticosa is considered one of the most invasive species, native to the south-eastern part of North America, widely introduced in North Asia and Europe (
Recent interdisciplinary studies conducted in the framework of FP7 enviroGRIDS project – Building Capacity for a Black Sea Catchment Observation and Assessment supporting Sustainable Development (WP5 – Impacts on Selected Societal Benefit; Sub-task 5.6.2: Terrestrial Invasive Plant Species in Romanian Protected Areas) have identified and assessed A. fruticosa in the Danube Delta Biosphere Reserve, Comana and Mureş Floodplain Natural Parks in relation to species preference for different natural and human-induced conditions (Dumitraşcu and Grigorescu 2016). Thus, large areas covered with A. fruticosa were spotted in wetlands, along forest roads, in arable lands, in the proximity of transport routes etc. (
Limited resources are available for the control of these plants (
Materials and methods
The study-area
Mureş Floodplain Natural Park is located in the western part of Romania (20°53'E; 46°07'N) in the Panonic biogeographic region (Fig.

The Mureş Floodplain Natural Park, established in 2004 through Government Decision no. 2151/2004, falls into V IUCN category - Protected Landscape (Natural Park) and Natura 2000 European Network, both SPA – Special Protection Areas and SCI - Site of Community Importance. Furthermore, since 2006, the area was included on the RAMSAR list as Wetlands of International Importance. The Park is a typical wetland area with running and still waters, alluvial forests, as well as an important place for nesting and passage for a large number of bird species of international importance (
Generally, the area is a floodplain with altitudes decreasing from about 110 m (in east) to about 80 m (in west). The climate is temperate-continental with oceanic humid influences (
According to the geographical distribution of habitats, the importance of the species and management, the Park is divided into three different zones: (1) the totally protected area (6%) which includes the most valuable natural elements, (2) the sustainable management area (92%), also called the buffer zone, which makes the transition between the totally protected area and (3) the sustainable development area (2%) which includes built-up areas or natural resources exploitation sites that existed prior to the designation of the protected area. Within the totally protected area, any form of use of natural resources, construction or investments which do not meet the sustainable management of the protected natural area and/or scientific research activities is forbidden. In the buffer zone, it is prohibited to build new constructions, except for those that strictly serve the protected natural area, the scientific research activities or those meant to ensure national safety or the prevention of natural disasters. Investments or development activities are accepted in the sustainable development area, priority being given to tourism, albeit respecting the sustainable use of natural resources and the prevention of any significant negative effects on biodiversity (
Methodology
The current study aims to explain the relationships between A. fruticosa occurrence and its explanatory driving forces, on one hand and to model the probability of the potential distribution using spatial analysis and binary logistic regression (BLR), on the other. The methodology, used in the present study, includes three main stages: the extraction of the geospatial datasets, the spatial analysis using GIS and the statistical analysis using SPSS (Statistical Package for the Social Sciences) software package. Synthetically, Figure

Data and data processing
Based on field research findings, as well as on data availability, eight spatial datasets representing the dependent and the independent variables (Fig.

Dependent variable: A. fruticosa occurrence
The layer of A. fruticosa presence/absence in the Mureş Floodplain Natural Park was derived from the data collected during the field surveys which were carried out between 2012 and 2016. The mapping was realised using topographic maps (1:25000 scale) and, for more accuracy, using orthophoto images (scale 1:5000) and GPS measurements. The species was identified in various habitat types where field relevés with over 20% coverage (according to Braun – Blanquet scale) and frequency (according to Raunkiaer scale) were taken into consideration (
With respect to the dataset used to model the probability map, a binary raster with the categories “presence” (coded with 1) and “absence” (coded with 0) was generated (Fig.
Explanatory factors
After processing different maps (topographic, soil and hydrogeological) and orthophoto images, six thematic layers were extracted and analysed: soil characteristics, piezometric level, surface waters, forests, built-up areas and roads from where soil type, depth to water, forest fragmentation, distance to roads, distance to waters and distance to settlements were derived.
In order to assess the occurrence of A. fruticosa within the dominant vegetation cover, the NDVI(Normalised Difference Vegetation Index) was used. This index was calculated using the Landsat 8 OLI_TIRS (Operational Land Imager_Thermal Infrared Sensor, accessed July 18, 2017) acquired from the United States Geological Survey – USGS (portal available at http://www.usgs.gov/). This index, developed by Rouse et al. in 1974 and widely used for the remote sensing of vegetation, is a measure of surface reflectance and gives a quantitative estimation of vegetation growth and biomass (
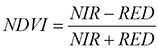 , (Eq.1)
where NIR = reflectance in the near infrared band; RED = reflectance in the red (visible) band.
The resultant NDVI values ranged between –0.245 and 0.714. After the visual interpretation of orthophoto images, the NDVI values were considered as representing: no vegetation areas (aquatic surface, bare soils, built-up areas, recent riverbed deposits) (NDVI <0); agricultural crops (NDVI = 0…0.25); herbaceous vegetation (NDVI = 0.25…0.4); transitional woodland-scrub (0.40…0.55); forest vegetation (NDVI >0.55).
Total edge (TE), calculated as the sum of the lengths (m) of all edge segments in a class or landscape (
The input independents variables used to assess A. fruticosa potential occurrence.
| Data layer | Meaning | Source | Data type | Assumption |
|---|---|---|---|---|
| Soil type (ST) | chernozems; haplic chernozems; erodisols; lacovishte; protisols; solonetz; fluvisols; eutric cambisols; glaysols; pelisols | National Research & Development Institute for Pedology, Agrochemistry and Environment Protection) | categorical | specific characteristics (e.g. soil moisture, nutrient availability, microorganisms, humus quality and quantity, pH) which play an important role in the occurrence of the invasive species |
| (scale 1:200 000) | ||||
| Depth to water (DW) | low piezometric level (<2 m); | Hydrogeological map (Geological Institute of Romania) | categorical | lower piezometric levels are assumed to be more suitable for invasive species occurrence due to the better connectivity to groundwater |
| medium piezometric level (2–5 m) | ||||
| high piezometric level (>5 m) | (scale 1:100 000) | |||
| Forest fragmentation (FF) | slightly fragmented forests (TE <2000 m) | derived from orthophoto images | categorical | forest fragmentation could increase ecosystems’ vulnerability to invasive species |
| moderate fragmented forests (TE 2000–5000 m) | ||||
| highly fragmented forests (TE >5000 m) | (scale 1: 5 000) | |||
| Normalised Difference Vegetation Index (NDVI) | no vegetation areas (NDVI <0) | derived from LANDSAT 8 satellite image (30 m resolution) | categorical | vegetation cover can lead to spatial heterogeneity in invasive species distribution |
| crop lands (NDVI = 0–0.25) | ||||
| grasslands (NDVI = 0.25–0.40) | ||||
| transitional woodland-scrub (NDVI = 0.40–0.55) | ||||
| forests (NDVI = >0.55) | ||||
| Proximity to roads (PR) | distance to nearest roads (buffer = 0.1 km) | derived from topographic map (scale 1:25 000) | continuous | influence of roads in ecosystems fragmentation |
| role of roads in facilitating the movement of the invasive species | ||||
| road traffic can favour invasive species’ expansion (tolerance to polluting environments) | ||||
| Proximity to settlements (PS) | distance to nearest settlements (buffer = 0.5 km) | derived from topographic map (scale 1:25 000) | continuous | the invasive species could be facilitated by human activities (e.g. plantation as ornamental species, natural habitat disturbance) |
| Proximity to waters (PW) | distance to nearest waters (buffer = 0.5 km) | derived from topographic map (scale 1:25 000) | continuous | water is considered as one of the main vectors for invasive species dissemination |
| fluvial processes can generate natural disturbances that create suitable sites for invasive species expansion | ||||
| water can generate a microclimate with potential influence on the invasive species expansion |
Statistical analysis
In the present study, to assess the relationships of the site characteristics and A. fruticosa presence/absence, BLR was applied. This method is the most commonly used parametric model aimed at determining the empirical relationships between a dependent and several independent variables (
 , (Eq.2)
then the probability of occurrence can be estimated with the following logistic regression model:
 , (Eq.3)
where P(Y =1|X1, X2, ..., Xi) is the probability of the dependent variable Y being 1 given (X1, X2, ..., Xi), i.e. the probability of a cell of being invaded by invasive species; Xi is an independent variable representing the explanatory factors of A. fruticosa and βi is the coefficient for variable Xi.
The response of these regression functions is visualised into the raster probability map based on the location suitability, given the probability of the occurrence of A. fruticosa in each resultant raster cell.
In order to reduce the effects of multi-collinearity, before the logistic regression analysis, Pearson correlations between each pair of independent variables were conducted and examined. In case of strong correlations (min. ±0.7), the better predictor variable (in univariate trials) was retained. Furthermore, to verify the explanatory power of the variables included in the sub-model, the Cramer’s V statistics tool was used. Cramer’s V is a statistic that transforms chi-square (for a contingency table larger than two rows by two columns) to a range of 0–1, where unit value indicates complete agreement between the two nominal variables (
Model calibration and assessment of potential distribution
The BLR was performed using the backward stepwise method in SPSS in order to obtain the best-fit combination for predictors. Thus, the variables, which collectively best explain A. fruticosa occurrence, were adopted by the regression model. To indicate the effectiveness of the each sets, a Nagelkerke pseudo R square (
Based on the corresponding coefficients of the best fit predictor set, the relative contribution of the explanatory variables of the A. fruticosa occurrence was assessed and the potential distribution probability map was generated. To categorise the resultant map, five classes were used to classify the probability values: very high, high, medium, low and very low probability. The classification was performed by Natural breaks (Jenks), a method that seeks to reduce the variance within classes and to maximise the variance between classes (
Spatial validation
Usually, in the analysis and modelling of spatial data, real datasets are used to validate the performance using different techniques. A typical procedure is splitting data into two parts (
Results
The occurrence of A. fruticosa in relation to the analysed explanatory variables
In terms of the analysed explanatory factors, A. fruticosa distribution across the park has a relative spatial heterogeneity. The frequency analysis (Fig.

Correlation analysis amongst the explanatory variables
The Pearson correlation analysis between the independent variables showed that the variables were not highly inter-correlated (max. ±0.30), which suggests the absence of multi-collinearity. The highest values were found between NDVI (>0.55) and slightly fragmented forests (0.298), depth to water (<2 m) and protisols (0.255). The lowest coefficients (0.001) were found between slightly fragmented forests and chernozems soil type, moderate fragmented forests and depth to water (>5 m), NDVI (0–0.25) and lacovishte soil type.
Association between dependent variable and explanatory variables using Cramer’s V test
The explanatory power of the independents’ variables was tested based on the Cramer’s V statistics. According to this method, the analysed explanatory factors were not strongly associated with A. fruticosa occurrence. Overall, continuous and few categorical variables were found to have better association with A. fruticosa occurrence with Cramer’s V values between 1.5 and 2.3: proximity to roads (V = 0.224), proximity to settlements (V = 0.221), proximity to waters (V = 0.193), piezometric level <2 m (V = 0.151), moderate forest fragmentation (V = 0.161) and NDVI values between 0 and 0.25 (V = 0.152). Furthermore, except for erodisols (V = 0.143), protisols (V = 0.122), fluvisols (V = 0.113), piezometric level between 2 and 5 m (V = 0.114), highly fragmented forests (V = 0.105) and NDVI values between 0.25 and 0.40 (V = 0.11), remaining variables have values less than 0.1, indicating a weakly association with the A. fruticosa occurrence.
Logistic regression modelling
Setting the backward stepwise in the BLR, eight steps for the best predictor sets resulted (Table 2). Variables that were not statistically significant, associated with A. fruticosa occurrence within the 95% confidence interval, were identified and automatically excluded by the model. Thus, the best-fit combination for predictors was found in step eight, which includes seventeen explanatory factors (Table 3).
Regression coefficients, indicating the effectiveness of eight sets of predictors, resulted after setting the backward method in BLR.
| set | Nagelkerke R2 | AUC |
|---|---|---|
| 1 | 0.161 | 0.648 |
| 2 | 0.195 | 0.743 |
| 3 | 0.220 | 0.769 |
| 4 | 0.228 | 0.777 |
| 5 | 0.237 | 0.790 |
| 6 | 0.241 | 0.794 |
| 7 | 0.242 | 0.797 |
| 8 | 0.243 | 0.798 |
| Independents’ variables | β | p | Odds ratio (OR) |
|---|---|---|---|
| Erodisols (soil type) | 2.923 | 0.000 | 18.588 |
| Protisols (soil type) | 2.101 | 0.000 | 8.171 |
| Fluvisols (soil type) | 1.940 | 0.000 | 6.961 |
| Depth to water (0–2 m) | 1.587 | 0.000 | 4.891 |
| Depth to water (2–5 m) | 0.867 | 0.000 | 2.381 |
| Depth to water (>5 m) | –1.065 | 0.000 | 0.345 |
| Forest fragmentation (low) | 0.193 | 0.000 | 1.213 |
| Forest fragmentation (medium) | 0.672 | 0.000 | 1.959 |
| Forest fragmentation (high) | 1.167 | 0.000 | 3.211 |
| NDVI (< 0) | 0.202 | 0.035 | 1.224 |
| NDVI (0–0.25) | 0.415 | 0.032 | 1.515 |
| NDVI (0.25–0.40) | 0.872 | 0.039 | 2.392 |
| NDVI (0.40–0.55) | 0.833 | 0.049 | 2.301 |
| NDVI (>0.55) | 0.326 | 0.043 | 1.385 |
| Proximity to roads | –0.694 | 0.000 | 0.500 |
| Proximity to settlements | –0.155 | 0.000 | 0.857 |
| Proximity to waters | 0.006 | 0.018 | 1.006 |
| Constant | –13.056 | 0.074 |
For set-8, the regression “goodness of fit” measured by the Nagelkerke R2 is -0.243 which, according to
The relative contribution of the explanatory factors was evaluated using the corresponding coefficients in the BLR (Table 3). Based on the coefficients’ values, all the explanatory variables were ranked. Thus, amongst all variables, erodisols, protisols and luvisols were found as the most significant predictors for A. fruticosa occurrence in the study area. All values of OR are greater than one, indicating a higher probability of A. fruticosa occurrence in those areas comparing to other soil type classes. The probability of A. fruticosa occurrence in areas with erodisols is larger than the probability in areas covered with protisols. The areas with protisols present more suitability for A. fruticosa occurrence than areas with luvisols. This can be seen from the odds ratio values of 18.59, 8.17 and 6.96 in a decreasing order for erodisols, protisols and luvisols, respectively.
The regression model showed a positive relationship between A. fruticosa occurrence and depth to water for piezometric level less than 2 m and between 2 and 5 m and negative relation with respect to a piezometric level higher than 5 m. This means that, with the increase in depth to water, the A. fruticosa occurrence decreases due to less connectivity to groundwater. This can be seen in the odds ratio values (4.89, 2.38 and 0.35) in a decreasing order for the piezometric level. Furthermore, the positive values of β and OR show that A. fruticosa tends to spread in moderate and mainly highly fragmented forests. However, the positive values of β (0.19) and the value of OR greater than one (1.21) for slightly fragmented forests also demonstrate that the species can spread in rather compacted afforested areas.
The model also demonstrates that A. fruticosa is in relation to vegetation cover, the positive β coefficients and OR values for NDVI values >0.25 showing the tendency of species to spread in areas with grasslands, transitional woodland-scrub and afforested areas. The estimated β value (–0.694) and OR (0.50) for the proximity to roads indicates that the probability of A. fruticosa occurrence further away from roads is less expected. Specifically, the probability of species occurrence would decrease 2 times if distance to roads increases by 0.1 km. The model demonstrates that A. fruticosa occurrence is not significantly controlled by the proximity to settlements, however the negative value of β (–0.16) indicates that, with the increase in distance to settlements, the probability of this invasive terrestrial species to occur decreases. Thus, the odds of A. fruticosa occurrence in an area 0.5 km closer to settlements is estimated to be 1.17 as large as that in areas further away from settlements.
The regression results for proximity to waters (β = 0.006; OR = 1.006) revealed that they have no significant influence on A. fruticosa occurrence.
The probability map of A. fruticosa occurrence
The probability of A. fruticosa occurrence was assessed by plugging the β coefficients of the logistic regression model containing the 17 significant predictors (Table 3) into Eq. (3). Thus, the probability map (Fig.

The mapped areas (A) and the probability of A. fruticosa occurrence, based on the BLR (B).
In order to conduct the spatial validation of the model, the map of A. fruticosa occurrence probability, computed using the logistic regression model, was compared with the actual A. fruticosa occurrence (reference datasets used for validation). Thus, the cross-classification map reveals a relatively good spatial fit between the observed data and the predicted data (Fig.

Discussion
A. fruticosa location in the Mureș Floodplain Natural Park
The field surveys in the Mureș Floodplain Natural Park have shown A. fruticosa occurrence in different ecosystems and habitats, significantly affecting the native vegetation. The species were identified mainly along the forest roads edges and forest glades (especially north to Mureș River), as well as along the edges of arable lands (mainly abandoned, unused) with a tendency to invade them in the west and north-west of Felnac locality. The largest area was identified in the western part of Pecica locality and north-west of Fenlac, along the forest roads and at the contact between forested areas and pastures or arable lands. Therewith, the species has a significant spread south-west of Şeitin locality on arable lands and along Mureş River (Fig.

A. fruticosa invading: A crop lands B grasslands C abandoned agricultural land west of Pecica locality D, E Mureș River riverbed F forest roads.
In relation to park zoning, out of the total mapped surface, 1.7% is located in the totally protected area (Felnac, Libus), 13.6% in the sustainable development area (largely in Pecica locality), while the remainder (84.7%) is in the sustainable management area, mainly spreading along the left bank of Mureş River.
The main explanatory factors of A. fruticosa occurrence. Expected invasion
The driving factors of A. fruticosa occurrence may vary from place to place. Many factors can affect the establishment and spread of invasive species (
In the present study, the selected explanatory variables encompass a significant share of the driving factors. Many studies have indicated that most of the analysed factors were also found to be important in other protected wetland areas in Romania (
A. fruticosa is considered a weak competitor in forests because it is usually excluded by tree species (
It is widely known that roads can serve as corridors for the movement of invasive species (
In this respect, the authors consider that the more ecosystems and habitats are affected by disturbance, the more likely they become invaded by A. fruticosa. Thus, future forest fragmentation and clearing, the extension of the transportation network and the abandonment of the agricultural lands will increase the potential spread of A. fruticosa. Furthermore, planting A. fruticosa for different purposes (on the degraded lands, protection of dams or roads) will facilitate species’ invasion within the important habitats and ecosystems of the Park.
Importance of the study. Perspectives
Invasive species may cause cascading effects in communities and/or affect both biotic and abiotic components of ecosystems (
Limitation of the results
Uncertainty is an inevitable component of invasion forecasts (
Another limitation refers to the unavailable datasets for the independent variables. Thus, the resulted pseudo R2 values indicate that only 24.3% of A. fruticosa occurrence in the Mureş Floodplain Natural Park can be influenced by the analysed explanatory factors and the remaining percentage was influenced by other factors. Thus, in order to allow a better and realistic modelling of species’ spreading potential in the future at a much finer scale, more information on the spatial distribution of A. fruticosa combined with other predictors (e.g. soil nutrients and heavy metals content, past land-use changes, existing plant community) must be integrated. Moreover, the coarse resolution of the available soils and depth to water data have also restricted the accuracy of the model. One more limitation is related to the final probability map which does not reflect its temporal probability. As it is difficult or impossible to model seed dispersal at a regional scale (
Conclusions
The present study is a geographical approach to assess spatial potential spreading of one of the most disturbing invasive terrestrial plant species in Europe (A. fruticosa) in one of the most important natural protected area in Romania (Mureş Floodplain Natural Park). Cross-referencing the scientific findings on the assessment of invasive species in Romania, revealed that the present study is one of the first attempts to explain the spatial relationships between this invasive terrestrial plant species and its explanatory factors and to assess potential distribution, integrating GIS and logistic regression into spatial simulation. Thus, the model shows that the explanatory factors of A. fruticosa occurrence are varied and have different influences, confirming previous findings of scientific literature and other current research on the increased tolerance and high adaptation capacity of this invasive species to a variety of conditions. The probability map, resulting from plugging the β coefficients of the logistic regression, indicates that spreading of A. fruticosa is expected to continue mainly in the areas where significant parcels were mapped (close to Pecica, Semlac and Seitin localities), but with extension into the eastern and central part of the Park, close to Arad, Felnac, Secusigiu and Nadlac localities. This could indicate a future strong adaptation capacity of A. fruticosa to many terrestrial ecosystems and, consequently, a serious threat for the native terrestrial plant species, requiring the inclusion of specific measures in the park’s management plan.
Acknowledgements
The current research was undertaken in the framework of the EU FP7 – Building Capacity for Black Sea Catchment Observation and Assessment System supporting Sustainable Development (EnviroGRIDS) and of the research project carried out under the research plan of the Institute of Geography, Romanian Academy “The National Geographic Atlas of Romania”. Image courtesy for the LANDSAT satellite images of U.S. Geological Survey available at: www.usgs.gov.
References
- Almasi KN (2000) A non-native perennial invades a native forest. Biological Invasions 2(2): 219–230. https://doi.org/10.1023/A:1010009123469
- Anastasiu P, Negrean G (2005) Alien plants in Romania. Analele ştiinţifice ale Universităţii “Alexandru Ioan Cuza” Iaşi Biologie vegetală, LI, 87–96.
- Anastasiu P, Negrean G (2006) Alien vascular plants in Dobrogea (Romania) and their impact on different types of habitats. Plant, Fungal and Habitat Diversity Investigation and Conservation, Proceedings IV, BBC, Sofia, 590–596.
- Anastasiu P, Negrean G, Bas C, Sîrbu C, Oprea A (2008) A preliminary study on the neophytes of wetlands in Romania. In: Rabitsch W, Essl F, Klingenstein F (Eds) Biological Invasions – from Ecology to Conservation.Neobiota 7: 181–192.
- Andreu J, Vila M (2010) Risk analysis of potential invasive plants in Spain. Journal for Nature Conservation 18(1): 34–44. https://doi.org/10.1016/j.jnc.2009.02.002
- Arim M, Abades SR, Neill PE, Lima M, Marquet PA (2006) Spread dynamics of invasive species. PNAS 103(2): 374–378. https://doi.org/10.1073/pnas.0504272102
- Bailey J, Bimova K, Mandak B (2007) The potential role of polyploidy and hybridisation in the further evolution of the highly invasive Fallopia taxa in Europe. Ecological Research 22(6): 920–928. https://doi.org/10.1007/s11284-007-0419-3
- Bălteanu D, Dumitraşcu M, Geacu S, Ciupitu D (2016) Ariile naturale protejate. In: Romania. Space, Society, Environment. Romanian Academy, Bucharest, 542-563.
- Blagojević M, Konstantinović B, Samardžić N, Kurjakov A, Orlović S (2015) Seed Bank of Amorpha fruticosa L. on Some Ruderal Sites in Serbia. Journal of Agricultural Science and Technology B 5(2): 122–128. https://doi.org/10.17265/2161-6264/2015.02B.006
- Bogdan O (2004) Regionarea climatică în: România. In: Calitatea solurilor şi reţeaua electrică de transport. Atlas geographic. Romanian Academy Publishing House, 6.
- Bogdan O, Dragotă C, Micu D (2016) Potențialul climatic. In: In: Romania. Space, Society, Environment. Romanian Academy, Bucharest, 102–130.
- Brothers TS, Spingarn A (1992) Forest fragmentation and alien plant invasion of central Indiana old-growth forests. Conservation Biology 6(1): 91–100. https://doi.org/10.1046/j.1523-1739.1992.610091.x
- Cadanasso ML, Pickett ST (2001) Effect of edge structure on the flux of species into forest interiors. Conservation Biology 15(1): 91–97. https://doi.org/10.1111/j.1523-1739.2001.99309.x
- Callaway RM, Ridenour WM (2004) Novel weapons: Invasive success and the evolution of increased competitive ability. Frontiers in Ecology and the Environment 2(8): 436–443. https://doi.org/10.1890/1540-9295(2004)002[0436:NWISAT]2.0.CO;2
- Charles H, Dukes JS (2006) Impacts of Invasive Species on Ecosystem Services in Ecological Studies. Biological Invasions 193: 9–15.
- Christen D, Matlack G (2006) The role of roadsides in plant invasions: A demographic approach. Conservation Biology 20(2): 385–391. https://doi.org/10.1111/j.1523-1739.2006.00315.x
- Clark WAV, Hosking PL (1986) Statistical Methods for Geographers. Wiley, New York.
- Cowie ID, Werner PA (1993) Non-native plant species invasive in Kakadu National Park, tropical northern Australia. Biological Conservation 63(2): 127–135. https://doi.org/10.1016/0006-3207(93)90500-Z
- Delai F, Kiss T, Nagy J (2018) Field-based estimates of floodplain roughness along the Tisza River (Hungary): The role of invasive Amorpha fruticosa. Applied Geography (Sevenoaks, England) 90: 96–105. https://doi.org/10.1016/j.apgeog.2017.11.006
- De Poorter M, Pagad S, Ullah MI (2007) Invasive alien species and protected areas. A scoping report. Part I. Scoping the scale and nature of invasive alien species. Threats to protected areas, impediments to IAS. Management and means to address those impediments. Produced for the World Bank as a contribution to the Global Invasive Species programme (GISP). http://www.issg.org/pdf/publications/gisp/resources/ias_protectedareas_scoping_i.pdf
- Dirnbock T, Greimler J, Lopez PS, Stuessy TF (2003) Predicting Future Threats to the Native Vegetation of Robinson Crusoe Island, Juan Fernandez Archipelago, Chile. Conservation Biology 17(6): 1650–1659. https://doi.org/10.1111/j.1523-1739.2003.00173.x
- Doroftei M (2009) Chorology of Amorpha fruticosa in Danube Delta. Romanian Journal of Plant Biology 54(1): 61–67.
- Dumitraşcu M, Grigorescu I, Kucsicsa G, Dragotă C, Năstase M (2011) Non-native and native invasive terrestrial plant species in Comana Natural Park. Case-studies: Amorpha fruticosa and Crataegus monogyna. Rev. Roum. Géogr. Rom. Journ. Geogr.55(2): 81–89.
- Dumitraşcu M, Grigorescu I, Doroftei M, Kucsicsa G, Mierlă M, Dragotă C, Năstase M (2013) Amorpha fruticosa in three wetland areas: Danube Delta Biosphere Reserve, Comana and Mureş Floodplain Natural Parks, The 13th International Multidisciplinary Scientific GeoConference SGEM, 16–22 iunie, 2013, Albena, Bulgaria, Ecology, Economics, Education and Legislation Conference Proceedings 1: 113–124. http://sgem.org/sgemlib/spip.php?article3268
- Dumitraşcu M, Grigorescu I, Kuscicsa G, Doroftei M, Năstase M, Dragotă C (2014) Invasive terrestrial plant species in the Romanian protected areas. A geographical approach. Rev. Roum. Géogr. Rom. Journ. Geogr.58(2): 145–160.
- Elakowich SD, Wooten JW (1995) Allelopathyc woody plants I. Abies alba through Lyonia lucida. Allelopathy Journal 2: 117–146.
- Elith J, Graham CH, Anderson RP, Dudík M, Ferrier S, Guisan A, et al. (2006) Novel methods improve prediction of species’ distributions from occurrence data. Ecography 29(2): 129–151. https://doi.org/10.1111/j.2006.0906-7590.04596.x
- Fenesi A, Ruprecht EK, Vincze E (2009) Aggressively spreading exotic plant species in Romania. Neobiota din Romania. Presa Universitara Clujeana.
- Franklin J (1995) Predictive vegetation mapping: Geographic modelling of biospatial patterns in relation to environmental gradients. Progress in Physical Geography 19(4): 474–499. https://doi.org/10.1177/030913339501900403
- Fukasawa K, Koike F, Tanaka N, Otsu K (2009) Predicting future invasion of an invasive alien tree in a Japanese oceanic island by process-based statistical models using recent distribution maps. Ecological Research 24(5): 965–975. https://doi.org/10.1007/s11284-009-0595-4
- Gallé L, Margóczy K, Kovács E, Gyrffy G, Körmöczy L, Németh L (1995) River valleys: Are they ecological corridors? Tiscia 29: 53–58.
- Goslee SC, Debra PC, Peters DPC, Beck GK (2006) Spatial prediction of invasion success across heterogeneous landscapes using an individual-based model. Biological Invasions 8(2): 193–200. https://doi.org/10.1007/s10530-004-2954-y
- Grigorescu I, Dumitrascu M, Kucsicsa G, Doroftei M, Dragotă C, Năstase M (2014) Assessing Invasive Terrestrial Plant Species in the Mureş Floodplain Natural Park. Romania. The 14th International Multidisciplinary Scientific GeoConference SGEM, 17–26 iunie, 2014, Albena, Bulgaria, 1, Ecology & Environmental Protection, 51–58. https://doi.org/10.5593/SGEM2014/B51/S20.008
- Guisan A, Thuiller W (2005) Predicting species distribution: Offering more than simple habitat models. Ecology Letters 8(9): 993–1009. https://doi.org/10.1111/j.1461-0248.2005.00792.x
- Hall FG, Towhshend JR, Engman ET (1995) Status of remote sensing algorithms for estimation of land surface state parameters. Remote Sensing of Environment 51(1): 138–156. https://doi.org/10.1016/0034-4257(94)00071-T
- Harrison S, Hohn C, Ratay S (2002) Distribution of exotic plants along roads in a peninsular nature reserve. Biological Invasions 4(4): 425–430. https://doi.org/10.1023/A:1023646016326
- Hensher DA, Johnson LW (1981) Applied Discrete Choice Modeling. Croom Helm, London.
- Higgins SI, Richardson DM, Cowling RM, Trinder Smith TH (1999) Predicting the landscape-scale distribution of alien plants and their threat to plant diversity. Conservation Biology 13(2): 303–313. https://doi.org/10.1046/j.1523-1739.1999.013002303.x
- Hosmer DW, Lemeshow S (1989) Applied logistic regression. Wiley, New York.
- Horssen PW, Pebesma EJ, Schot PP (2002) Uncertainties in spatially aggregated predictions from a logistic regression model. Ecological Modelling 154(1–2): 93–101. https://doi.org/10.1016/S0304-3800(02)00060-1
- Hutchinson GE (1957) Concluding remarks. Cold Spring Harbor Symposia on Quantitative Biology 22(0): 415–427. https://doi.org/10.1101/SQB.1957.022.01.039
- Jenks GF (1967) The Data Model Concept in Statistical Mapping. International Yearbook of Cartography 7: 186–190.
- Jiménez-Valverde J, Peterson AT, Soberón J, Overton JM, Aragón P, Lobo JM (2011) Use of niche models in invasive species risk assessments. Biological Invasions 13(12): 2785–2797. https://doi.org/10.1007/s10530-011-9963-4
- Joly M, Bertrand P, White MC, Lavoie C, Gbangou RY, Dube J (2011) Paving the Way for Invasive Species: Road Type and the Spread of Common Ragweed (Ambrosia artemisiifolia). Environmental Management 48(3): 514–522. https://doi.org/10.1007/s00267-011-9711-7
- Kanevski M, Maignan M (2004) Analysis and modelling of spatial environmental data. EPFL Press, 300 pp.
- Kucsicsa G, Grigorescu I, Dumitraşcu M (2013) Integrated methodology for the assessment of Invasive Terrestrial Plant Species potential distribution in the Romanian Protected Areas. A GIS-based approach. Proceedings of 9th WSEAS International Conference on Energy, Environment, Ecosystems and Sustainable Development, Recent Advances in Environmental Science, 150–155.
- Kucsicsa G, Grigorescu I, Dumitrascu M (2016) Integrated methodology and Data. In: Invasive Terrestrial Plant Species in the Romanian Protected Areas. A geographical approach. Romanian Academy Publishing House, 37–46.
- Lambdon P, Pyšek P, Basnou C, Hejda M, Arianoutsou M, Essl F, Andriopoulos P (2008) Alien flora of Europe: Species diversity, temporal trends, geographical patterns and research needs. Preslia 80(2): 101–149.
- Macdonald IAW, Graber DM, DeBenedetti S, Groves RH, Fuentes ER (1988) Introduced species in nature reserves in Mediterranean-type climatic regions of the world. Biological Conservation 44(1–2): 37–66. https://doi.org/10.1016/0006-3207(88)90004-3
- Mack MC, D’Antonio CM (1998) Impacts of biological invasions on disturbance regimes. Trends in Ecology & Evolution 13(5): 195–198. https://doi.org/10.1016/S0169-5347(97)01286-X
- Mack RN, Simberloff D, Lonsdale WM, Evans H, Clout M, Bazzaz FA (2000) Biotic invasions: Causes, epidemiology, global consequences, and control. Ecological Applications 10(3): 689–710. https://doi.org/10.1890/1051-0761(2000)010[0689:BICEGC]2.0.CO;2
- Magyar P (1960) Afforestation in Great Hungarian Plain. Akadémiai Kiadó, Budapest. [in Hungarian]
- McGarigal K, Marks BJ (1995) FRAGSTATS: spatial pattern analysis program for quantifying landscape structure. Gen. Tech. Rep. PNW-GTR-351.U.S. Department of Agriculture, Forest Service, Pacific Northwest Research Station, Portland, OR, 122 pp
- Mcgeochm MA, Stuart HM, Spear D, Marais E, Kleynhans EJ, Symes A, Chanson J, Hoffmann M (2010) Global indicators of biological invasion: Species numbers, biodiversity impact and policy responses. Diversity & Distributions 16(1): 95–108. http://www.cbd.int/sp/. https://doi.org/10.1111/j.1472-4642.2009.00633.x
- Mortensen DA, Emily SJ, Rauschert ESJ, Nord AN, Jones BP (2009) Forest Roads Facilitate the Spread of Invasive Plants. Invasive Plant Science and Management 2(03): 191–199. https://doi.org/10.1614/IPSM-08-125.1
- Mureş Floodplain Natural Park Administration (2016) Mureş Floodplain Natural Park Management Plan, National Forest Administration ROMSILVA, 193 pp.
- Panetta FD, Dodd J (1987) Bioclimatic prediction of the potential distribution of skeleton weed Chondrilla juncea L. in Western Australia. Journal of the Australian Institute of Agricultural Science 53: 11–16.
- Pearce JL, Venier LA, Ferrier S, McKenney DW (2003) Measuring prediction uncertainty in models of species distribution. Predicting Species Occurrences: Issues of Accuracy and Scale. The Auk 120(4): 1199–1200. https://doi.org/10.1642/0004-8038(2003)120[1199:PSOIOA]2.0.CO;2
- Pearson RG (2010) Species’ Distribution Modeling for Conservation Educators and Practitioners. Lessons in Conservation 3: 54–89.
- Pedashenko HP, Apostolova II, Kiril V, Vassilev KV (2012) Amorpha fruticosa invasibility of different habitats in lower Danube. Phytologia Balcanica 18(3): 285–291.
- Pulliam HR (2000) On the relationship between niche and distribution. Ecology Letters 33: 49–361. https://doi.org/10.1046/j.1461-0248.2000.00143.x
- Pyšek P, Hume PE (2005) Spatio-temporal dynamics of plant invasions: Linking pattern to process. Ecoscience 12(3): 302–315. https://doi.org/10.2980/i1195-6860-12-3-302.1
- Pyšek P, Jarošík V, Pergl J, Randall R, Chytrý M, Kühn I, Tichý L, Danihelka J, Chrtek jun J, Sádlo J (2009) The global invasion success of Central European plants is related to distribution characteristics in their native range and species traits. Diversity & Distributions 15(5): 891–903. https://doi.org/10.1111/j.1472-4642.2009.00602.x
- Pysek P, Jarosik V, Kucera T (2003) Inclusion of native and alien species in temperate nature reserves: An historical study from Central Europe. Conservation Biology 17(5): 1414–1424. https://doi.org/10.1046/j.1523-1739.2003.02248.x
- Radovanović N, Kuzmanović N, Vukojičić S, Lakušić D, Jovanović S (2017) Floristic diversity, composition and invasibility of riparian habitats with Amorpha fruticosa: A case study from Belgrade (Southeast Europe). Urban Forestry & Urban Greening 24: 101–108. https://doi.org/10.1016/j.ufug.2017.04.006
- Rejmánek M (1989) Invasibility of plant communities. Biological invasions: a global perspective. John Wiley & Sons, Chichester, 369–388.
- Rempel RS, Kaukinen D, Carr AP (2012) Patch Analyst and Patch Grid. Ontario Ministry of Natural Resources. Centre for Northern Forest Ecosystem Research, Thunder Bay, Ontario.
- Rew LJ, Maxwell BD, Aspinall R (2005) Predicting the occurrence of nonindigenous species using environmental and remotely sensed data. Weed Science 53(2): 236–241. https://doi.org/10.1614/WS-04-097R
- Richardson DM, Pysek P, Rejmánek M, Barbour MG, Panetta FD, West CJ (2000) Naturalization and invasion of alien plants: Concepts and definitions. Diversity & Distributions 6(2): 93–107. https://doi.org/10.1046/j.1472-4642.2000.00083.x
- Ricklefs RE, Schluter D (1993) Species diversity in ecological communities: historical and geographical perspectives. University of Chicago Press, Chicago, 414 pp.
- Rood SB, Braatne JH, Goater LA (2010) Favorable fragmentation: River reservoirs can impede downstream expansion of riparian weeds. Ecological Applications 20(6): 1664–1677. https://doi.org/10.1890/09-0063.1
- Rouget M, Richardson DM, Milton SJ, Polakow D (2001) Predicting invasion dynamics of four alien Pinus species in a highly fragmented semi-arid shrubland in South Africa. Plant Ecology 152(1): 79–92. https://doi.org/10.1023/A:1011412427075
- Rouse JW, Haas RH, Deering DW, Sehell JA (1974) Monitoring the vernal advancement and retrogradation (Green wave effect) of natural vegetation. Final Rep. RSC, 1978-4, Remote Sensing Center, Texas A&M Univ, College Station.
- Sărăţeanu V (2010) Assessing the influence of Amorpha fruticosa L. invasive shrub on some grassland vegetation types from western Romania. Research Journal of Agricultural Science 42(1): 536–540.
- Seo KW, Son Y, Rhoades CC, Noh NJ, Koo JW, Kim JG (2008) Seedling Growth and Heavy Metal Accumulation of Candidate Woody Species for Revegetating Korean Mine Spoils. Restoration Ecology 16(4): 702–712. https://doi.org/10.1111/j.1526-100X.2008.00485.x
- Shea K, Chesson P (2002) Community ecology theory as a framework for biological invasion. Trends in Ecology & Evolution 17(4): 170–176. https://doi.org/10.1016/S0169-5347(02)02495-3
- Silveri A, Dunwiddie PW, Michaels HJ (2001) Logging and edaphic factors in the invasion of an Asian woody vine in a mesic North American forest. Biological Invasions 3(4): 379–389. https://doi.org/10.1023/A:1015898818452
- Sîrbu C, Oprea A (2011) Plante adventive în flora Românei. Editura “Ion Ionescu de la Brad”, Iaşi, 733 pp.
- Sîrbu C, Oprea A, Eliáš P, Ferus P (2012) New data addition to the Romanian alien flora. Journal of Plant Development 19: 141–156.
- Sîrbu C, Oprea A, Doroftei M (2016a) Invasive Terrestrial Plant Species in Romania. In: Invasive Terrestrial Plant Species in the Romanian Protected Areas. A geographical approach. Romanian Academy Publishing House, 17–29.
- Sîrbu C, Oprea A, Doroftei M (2016b) Management and Control of Invasive Terrestrial Plant Species in Romania. Invasive Terrestrial Plant Species in the Romanian Protected Areas. A geographical approach. Romanian Academy Publishing House, 103–112.
- Stănescu V, Şofletea N, Popescu O (1997) Flora forerstieră lemnoasă a României. Edit. Ceres, Bucureşti.
- Szigetvári C (2002) Initial steps in the regeneration of a floodplain meadow after a decade of dominance of an invasive transformer shrub, Amorpha fruticosa L. TISCIA 33: 67–77.
- Turner MG (1989) Landscape ecology: The effect of patterns on process. Annual Review of Ecology and Systematics 20(1): 171–197. https://doi.org/10.1146/annurev.es.20.110189.001131
- Underwood EC, Klinger R, Moore PE (2004) Predicting patterns of non-native plant invasions in Yosemite National Park, California, USA. Diversity & Distributions 10(5–6): 447–459. https://doi.org/10.1111/j.1366-9516.2004.00093.x
- Václavík T, Meentemeyer RK (2009) Invasive species distribution modeling (iSDM): Are absence data and dispersal constraints needed to predict actual distributions? Ecological Modelling 220(23): 3248–3258. https://doi.org/10.1016/j.ecolmodel.2009.08.013
- Wang ET, van Berkum P, Sui XH, Beyene D, Chen WX, Martínez-Romero E (1999) Diversity of microbial associated with Amorpha fruticosa isolated from Chinese soils and description of Mesorhizobium amorphae sp. nov. International Journal of Systematic Bacteriology 49(1): 51–65. https://doi.org/10.1099/00207713-49-1-51
- Weber E, Gut D (2004) Assessing the risk of potentially invasive plant species in central Europe. Journal for Nature Conservation 12(3): 171–179. https://doi.org/10.1016/j.jnc.2004.04.002
- Williamson M (1996) Biological invasions. Chapman and Hall, London, 1–244.
- Xiang S, Xiaolei Z, Guangcai C, Yitai C, Ling W, Xiaoquan S (2011) Seedling growth and metal accumulation of selected woody species in copper and lead/zinc mine tailings. Journal of Environmental Sciences (China) 23(2): 266–274. https://doi.org/10.1016/S1001-0742(10)60402-0
- Yemshanov D, Koch FH, Ducey MJ (2015) Making invasion models useful for decision makers: incorporating uncertainty, knowledge gaps, and decision-making preferences. Pest Risk Modeling and Mapping for Invasive Alien Species. Wallingford, UK, CABI Publishing, 206–222. https://doi.org/10.1079/9781780643946.0206
- Dumitrascu M, Grigorescu I. (Ed.) (2016) Invasive Terrestrial Plant Species in the Romanian Protected Areas. A geographical approach, Romanian Academy Publishing House, 155 pp.
- McCullagh P, Nelder JA (1989) Generalized Linear Models. Chapman and Hall, New York. https://doi.org/10.1007/978-1-4899-3242-6
- Kleinbaum D. (1994) Logistic regression: a self-learning text. SpringerVerlag, New York. https://doi.org/10.1007/978-1-4757-4108-7
- Liebetrau AM (1983) Measures of association. Sage, Newbury Park, CA. https://doi.org/10.4135/9781412984942
- Nagelkerke NJD (1991) A note on a general definition of the coefficient of determination. Biometrika, 78(3), 691–692. https://doi.org/10.1093/biomet/78.3.691
- Pontius Jr RG, Schneider LC (2001) Land-cover change model validation by an ROC method for the Ipswich watershed, Massachusetts, USA. Agriculture, ecosystems and environment, 85(1–3), 239–248. https://doi.org/10.1016/S0167-8809(01)00187-6
- Mas JF, Soares Filho B, Pontius RG, Farfán Gutiérrez M, Rodrigues H (2013) A suite of tools for ROC analysis of spatial models. ISPRS International Journal of Geo-Information, 2(3), 869–887. https://doi.org/10.3390/ijgi2030869
- Marian M, Nicula C, Mihaly-Cozmuta L, Peter A, Mihaly-Cozmuta A (2010) Participation of the indigenous vs. alien herbaceous species to the constitution of vegetal layer on the Bozânta Mare tailing ponds, Analele Universităţii din Oradea – Fascicula Biologie, XVII, 1, pp. 134–141.