Review Article |
|
Corresponding author: Le Thanh An ( ltan@hce.edu.vn ) Academic editor: Irene Ring
© 2019 Le Thanh An, Janusz Markowski, Maciej Bartos, Agnieszka Rzenca, Piotr Namiecinski.
This is an open access article distributed under the terms of the Creative Commons Attribution License (CC BY 4.0), which permits unrestricted use, distribution, and reproduction in any medium, provided the original author and source are credited.
Citation:
An LT, Markowski J, Bartos M, Rzenca A, Namiecinski P (2019) An evaluation of destination attractiveness for nature-based tourism: Recommendations for the management of national parks in Vietnam. Nature Conservation 32: 51-80. https://doi.org/10.3897/natureconservation.32.30753
|
Abstract
National parks are increasingly recognized as playing an important role in the development of nature-based tourism destinations that promote effective management of natural resources and socioeconomic development. The paper was designed to evaluate the tourism attractiveness and performance of national parks in Vietnam. The tourism performance of 30 Vietnamese national parks was evaluated using multiple criteria decision analysis with the stochastic multicriteria acceptability analysis (SMAA) and preference ranking organization method for enrichment evaluation (PROMETHEE) method; thirteen national park attributes were used to determine tourism attractiveness, measured by an exponential weighted acceptability index. It was found that the Phong Nha – Ke Bang, Cuc Phuong, and Ba Be National Parks were most attractive for more than 95% of all possible preference structures. In addition, 12 non-dominated national parks were identified, and for an average supporter of most non-dominated protected areas, the trail criterion appears to be the most important. A statistically significant correlation was found between tourism attractiveness and the number of tourists who visited national parks. Our findings offer potentially useful information for decision makers in developing effective tourism marketing and management strategies for national parks in Vietnam.
Keywords
National park, nature-based tourism, PROMETHEE, SMAA, tourism attractiveness, Vietnam
Introduction
Nature-based tourism (NBT), also known as ecotourism or nature tourism, defined as travel to enable the enjoyment of undeveloped natural areas, is a rapidly-expanding area in the tourism travel sector (
In the Southeast Asia region, NBT is not only a high volume sector but also one that is growing rapidly. For example, Thailand’s national parks receive over 13.2 million tourists per year, which is approximately 16% of all tourists visiting the country (
In Vietnam, NBT is increasingly recognized as playing an important role in national development, particularly of the national tourism sector, and one that supports socioeconomic development in the rural areas surrounding the protected areas. Around 51% of the 9.5 million domestic tourists and 33% of 1.2 million foreign tourists in Vietnam took part in nature-based tourism in 1998 (
Vietnam’s national parks (NPs) are protected areas in the national systems of special-use forests (SUFs), which are intended to protect nature. Other objectives include the protection of landscapes, cultural and historical sites, and the provision of recreation and tourism (
An area with special potential to acquire financial sources of funding for natural resource management in Vietnam is the use of NBT in NPs (
The attractiveness of a travel destination is simply the ability of an area to attract and satisfy prospective tourists (
Furthermore, different strategies for tourism destinations can be evaluated by the broad application of multiple criteria decision support methods such as the Analytic Hierarchy Process (AHP) (
In these cases, stochastic multicriteria acceptability analysis (SMAA) can be used, this being a family of multicriteria decision-aiding (MCDA) methods for problems where uncertainty (incomplete, imprecise, and uncertain information) is a significant issue (
The aim of this paper is to explore the attributes associated with tourism attractiveness, and evaluate the tourism performance of national parks in Vietnam using stochastic multicriteria acceptability analysis. More specifically, it assesses various attributes of NP-based tourism destinations and ranks NP destinations. The attractiveness of Vietnamese NPs as nature-based tourism destinations is evaluated by the SMAA and PROMETHEE methods. In addition, the correlation between tourism attractiveness and the number of tourists visiting NPs is assessed. The paper also discusses recommendations for NP management, particularly with regard to the attractiveness of nature-based tourism.
Materials and methods
Selection of attributes for evaluating the tourism attractiveness of national parks
Various attributes associated with specific types of tourist destinations influence the motivation to visit a NP and to enjoy it. In other words, the park in this sense is best viewed as a package of tourism facilities and services, composed of a number of multidimensional attributes that together determine its attractiveness to a particular individual in a given choice situation.
In the conceptualization described above, thirteen attributes (criteria) were selected to evaluate the attractiveness of 30 NPs in Vietnam (Figure

Distribution of the thirty Vietnamese national parks. Source: Adapted to
Attributes for determining tourism attractiveness Vietnamese national parks.
| Attribute | Description |
|---|---|
| International importance | Were the national park or national park areas specified under international designations (Ramsar Site, United Nations Educational, Scientific and Cultural Organisation World Heritage Sites and United Nations Educational, Scientific and Cultural Organisation Biosphere Reserve), yes/no? |
| Biodiversity of plants and animals | Number of species of plants and animals recognized in the national park |
| Rare plants and animals | Number of species of plants and animals recognized in the national park that listed in the 2007 Vietnam Red Data Book |
| Historical, cultural and spiritual structures | Were the national park or national park areas nationally-recognized notable historical, cultural and spiritual sites or structures, yes/no? |
| Hotels & hostels | Number of beds in accommodation service |
| Trails | Signposted paths and nature trails in kilometers |
| Information services | Number of available information services offered (7 in total) (guided walks, botanic garden, museum, tourism service office, environmental education center, center for rescue, creature conservation and development, interpretive/informative boards) |
| Tourism cooperation | Number of enterprises contracting/linking the national park for tourism activities offered |
| Education & research cooperation | Number of domestic and international organizations/institutes that cooperate with the national park in research and educational fields |
| Diversity of outdoor activities | Number of available recreational activities offered (13 in total) (walking on natural trails, bird watching, spotting wildlife, plant observation, exploring/visiting caves, climbing/trekking, swimming, camping, campfire, cycling, sailing/boating/kayaking, zipline/canopy tour, fishing) |
| External access | Distance from the national park to the nearest city of more than 100,000 inhabitants in kilometers: Short (up to 50), Medium (between 50 and 100), and Large (over 100) |
| Internal assess | Do enterprises contracting/linking to the national park offer internal shuttle services, yes/no? |
| Local community | Is there a chance to enjoy traditional music/games/cultural activities which will be performed by minorities/local communities when visiting the national park, yes/no? |
It is clear from the attribute selection process that protected area-based destinations are complex systems and a range of different attributes may influence the choice of destination by the tourist, as well as the attractiveness of the destination itself. In this sense, it is necessary to identify the degree to which the selected attributes contribute to the attractiveness of a NP to the tourist in relation to others. Thirteen attributes of a NP (Table
Data collection
The present study on tourism attractiveness was part of a series of surveys intended for the collection of data related to the management of national parks in Vietnam (cf.
Apart from data survey collection, the study used information collected from secondary data sources (e.g. previous studies and reports) concerning the biodiversity status of protected areas (see Suppl. material
The SMAA and PROMETHEE method
The process of choosing a travel destination can be regarded as a multiple criteria decision analysis problem, whereby destinations are ranked according to the preferences of particular tourists. In such multiple-criteria decision analysis problems (
A = {a1,...,ai,...,am}
is evaluated based on a set of n criteria
G = {g1,...,gj,...,gn}
in order to deal with decision problems such as choosing the best alternative or ranking all alternatives from best to worst. In the case of ranking NP-based tourism attractiveness, the alternatives are Vietnam’s national parks (i.e. m = 30 NPs) and the criteria are the attributes according to which these parks would be evaluated (i.e. n = 13 criteria, see Table
The PROMETHEE method is a well-known outranging method (
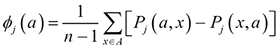
The PROMETHEE method acts by developing a preference function
Pj (a, b)
which is a function of the difference (dj) between the ratings of two alternatives
(a, b) ∈ A
for each criterion (j), i.e.
dj = gj (a) – gj (b)
where gj (a) and gj (b) are performance values of criterion j of two alternatives a and b, and takes values between 0 and 1. For each criterion, a specific preference function (Pj) must be defined, which can be one of six different functions (
and then the net outranking flow can be calculated as
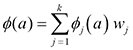
where wj are weights which describe the importance of each criterion for the decision-maker in case of tourists. The final ranking, also known as a complete PROMETHEE II ranking (
The PROMETHEE method can be used in the case of one decision-maker. In this case, the expressed preferences can be described as the individual weight vector, and the set of parameters of the preference function which correspond with the decision maker’s own ranking of alternatives. However, to assess the tourism attractiveness of Vietnamese NPs, it is necessary to not only consider the preferences of a single tourist, but also the preferences of each potential tourist visiting NPs. The best way to achieve this is by the stochastic multicriteria acceptability analysis (SMAA) method.
The SMAA method has been developed for discrete multicriteria problems where criteria values and/or weights or other model parameters are not precisely known (
The decision model in the original SMAA method (
based on these, a ranking of alternatives is constructed. In case of the SMAA-PROMETHEE method, net outranking flows are used instead of utility functions.
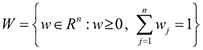
The set of all possible weighting vectors is denoted as feasible weight space and defined as
In addition, a set of favorable rank weights for alternative i is defined as all possible weight vectors for which alternatives i achieved r rank, defined as
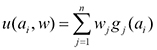
where the rank of each alternative is determined as an integer from the best rank (=1) to the worst rank (=m) by means of a ranking function u (ai ,w). The ranking function is defined as
where p (true) = 1 and p (false) = 0. Most importantly, the SMAA method outputs descriptive measures such as central weight vectors and rank acceptability indices.
The rank acceptability index can be defined as the ratio between the volume of the set of favorable rank weights and the volume of feasible weight space. This is computed by Monte Carlo simulation as a solution of the multidimensional integral:
where fw (w) is a density function of weight distribution. The rank acceptability indices can be interpreted as a percentage of all possible weight vectors which give alternative i rank r within range [0, 1], where 0 indicates that the alternative will never obtain a given rank and 1 indicates that it will always obtain the given rank with any choice of weights. The most acceptable (best) alternatives are those with high acceptability for the best (smallest) ranks. In the present study, rank acceptability indices were used to measure the tourism attractiveness of NPs. More precisely, the rank acceptability index for rank 1

shows how many possible combinations of weights support the first position in the ranking for a particular NP. In other words, it presents the proportion of different decision makers’ preferences to schemes, which result in a particular NP being the most attractive.
The central weight vector is the center of gravity for favorable weights space for rank=1. It is computed as an integral of the weight vector over the criteria and weight distributions as
With the assumed weight distribution, the central weight vector is the best single vector representation for a decision-maker who supports alternative i (
Statistical analyses and calculations
In the study, the rank acceptability index is considered as an indicator of tourism attractiveness; however, the problem arises as to which rank acceptability indices should be taken into account. The most obvious solution, i.e. the first rank acceptability index, cannot be implemented in cases where only some alternatives are not being dominated. For the dominated alternatives, regardless of weights, there always exists at least one better alternative, and the first acceptability index is equal 0. However, in practice, dominated NPs are chosen as the final destination by some tourists. In order to avoid this paradox, a model of exponential multiple choices is assumed, where some of the tourists visit more than one NP, and then choose alternatives from the lower ranks as their next destinations for their sets of weights. In addition, it is assumed that the number of tourists who visit more NPs decreases exponentially with the numbers of visited NPs. In this case, it is possible to construct an exponential weighted acceptability index biexp as
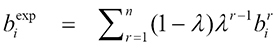
where n is the number of alternatives and r is the rank (r = 1,…,n), λ is a parameter of the method and bir is the rank acceptability index for rank r and alternative i. Parameter λ is optimized by a maximization of the Spearman’s rank correlation coefficient between exponential weighted acceptability indices and the number of tourists visiting NPs in 2015.
The PROMETHEE method was used to model the ranking process made by each tourist before choosing the destinations. To unify and simplify the model, two types of preference function were applied for the ranking process: usual and linear types. While both types depend on particular criteria, the usual types (Type 1, see Appendix 1) are associated with discrete variables and the linear types (Type 3, see Appendix 1) with continuous variables. For the linear type of general criterion, the threshold of strict preference p has been chosen as a maximum difference between the performance values of alternatives. One exception from this rule has been made for values of tourism cooperation criterion, where the strict preference threshold was set at 25 by expert judgment; this was agreed in response to the overwhelming dominance of Phong Nha - Ke Bang NP and the specification of the criterion for better description of potential preferences. The decision matrix for the tourism performance appraisal of 30 NPs can be found in Appendix 2, and a detailed assumption for NP selection in Appendix 3.
In addition, descriptive measures of SMAA computations are calculated by considering the number of Monte Carlo replications performed in order to obtain a sufficiently accurate approximation (
All calculations and statistical analyses in the study were performed using the software package R, version 3.3.3 (
Results
National parks’ characteristics
The 30 Vietnamese NPs differ markedly in terms of size, designation, geographical distribution and number of tourists (Table
| National parks | Year of establishment | Area (ha) | Other designation | Vietnam geographical region | Tourists by years | |
|---|---|---|---|---|---|---|
| 2005 | 2015 | |||||
| Hoang Lien | 2002 | 28.059 | AHP | NW | – | 116.305 |
| Ba Be | 1992 | 10.048 | RS, AHP | NE | – | 45.000 |
| Xuan Son | 2002 | 15.048 | – | NE | 500 | 21.780 |
| Cuc Phuong | 1962 | 22.200 | – | RRD | 63.258 | 71.600 |
| Cat Ba | 1986 | 17.363 | UBR, MPA | RRD | 57.000 | 412.346 |
| Ba Vi | 1991 | 10.815 | – | RRD | – | 216.050 |
| Tam Dao | 1996 | 34.995 | – | RRD | – | 14.176 |
| Bai Tu Long | 2001 | 15.783 | MPA | RRD | – | 12.838 |
| Xuan Thuy | 2003 | 7.100 | RS | RRD | 3.990 | 16.482 |
| Bach Ma | 1991 | 37.487 | – | NCC | 8.926 | 14.852 |
| Ben En | 1992 | 14.735 | – | NCC | – | 9.892 |
| Pu Mat | 1997 | 91.113 | UBR | NCC | 7.837 | 4.186 |
| Phong Nha – Ke Bang | 2001 | 123.326 | UWHS | NCC | 255.923 | 714.835 |
| Vu Quang* | 2002 | 57.038 | UBR | NCC | – | – |
| Cat Tien | 1992 | 72.634 | UBR, RS | CH | 16.043 | 26.664 |
| Yok Don | 1992 | 115.545 | – | CH | – | 1.760 |
| Chu Mom Ray* | 2002 | 56.621 | AHP | CH | – | – |
| Kon Ka Kinh* | 2002 | 42.143 | AHP | CH | – | – |
| Chu Yang Sin | 2002 | 58.971 | – | CH | – | 30.000 |
| Bidoup-Nui Ba | 2004 | 70.038 | UBR | CH | – | 7.442 |
| Nui Chua | 2003 | 29.865 | MPA | SCC | – | 530 |
| Phuoc Binh | 2006 | 19.814 | – | SCC | – | 1.200 |
| Con Dao | 1993 | 20.000 | RS, MPA | SE | – | 19.753 |
| Bu Gia Map | 2002 | 25.779 | – | SE | – | 1.239 |
| Lo Go – Xa Mat | 2002 | 19.156 | – | SE | – | 3.369 |
| Tram Chim | 1998 | 7.588 | RS | MRD | – | 175.208 |
| Phu Quoc* | 2001 | 29.421 | UBR, MPA | MRD | – | – |
| U Minh Thuong | 2002 | 8.038 | UBR, RS, AHP | MRD | – | 50.040 |
| Mui Ca Mau | 2003 | 41.862 | UBR, RS | MRD | – | 109.372 |
| U Minh Ha | 2006 | 8.528 | UBR | MRD | – | 16.886 |
In the context of tourism development, the majority of NPs (87%) administered tourism activities (Table
Ranking of tourism performance of Vietnamese national parks
The obtained rank acceptability indices, calculated according to the SMAA-PROMETHEE method, for 30 Vietnamese NPs are presented in Table
| National Park | Rank acceptability index for rank (%) | Sum of rank acceptability indices for ranks (%) | ||||||
|---|---|---|---|---|---|---|---|---|
| 1 | 2 | 3 | 4 | 5 | 6–10 | 11–20 | 21–30 | |
| Phong Nha - Ke Bang* | 70.423 | 14.702 | 6.944 | 3.004 | 1.767 | 2.723 | 0.437 | 0.000 |
| Cuc Phuong* | 20.324 | 31.976 | 20.639 | 11.963 | 6.431 | 8.451 | 0.216 | 0.000 |
| Ba Be* | 5.462 | 28.521 | 28.774 | 17.852 | 9.651 | 9.598 | 0.142 | 0.000 |
| Hoang Lien* | 1.234 | 9.995 | 13.454 | 15.471 | 16.155 | 40.133 | 3.556 | 0.002 |
| Bidoup-Nui Ba* | 1.077 | 2.891 | 4.755 | 7.751 | 12.613 | 64.718 | 6.195 | 0.000 |
| Tam Dao* | 0.839 | 1.990 | 3.269 | 6.418 | 9.663 | 65.159 | 12.558 | 0.104 |
| Cat Ba* | 0.609 | 3.877 | 5.521 | 9.399 | 11.800 | 59.309 | 9.485 | 0.000 |
| Cat Tien* | 0.091 | 5.051 | 13.072 | 20.088 | 15.629 | 38.939 | 7.127 | 0.003 |
| Nui Chua* | 0.005 | 0.038 | 0.124 | 0.335 | 0.550 | 26.944 | 70.294 | 1.710 |
| Chu Yang Sin* | 0.002 | 0.006 | 0.008 | 0.023 | 0.052 | 2.558 | 63.348 | 34.003 |
| Ba Vi* | 0.001 | 0.958 | 3.015 | 6.510 | 12.676 | 69.963 | 6.869 | 0.008 |
| Pu Mat* | 0.001 | 0.046 | 0.410 | 1.100 | 2.655 | 54.713 | 39.827 | 1.248 |
| Bach Ma | 0.000 | 0.000 | 0.001 | 0.003 | 0.005 | 13.794 | 85.111 | 1.086 |
| Bai Tu Long | 0.000 | 0.000 | 0.000 | 0.000 | 0.001 | 0.672 | 51.102 | 48.225 |
| Ben En | 0.000 | 0.000 | 0.000 | 0.000 | 0.008 | 9.162 | 84.733 | 6.097 |
| Bu Gia Map | 0.000 | 0.000 | 0.005 | 0.030 | 0.189 | 12.980 | 82.180 | 4.616 |
| Chu Mom Ray | 0.000 | 0.000 | 0.000 | 0.000 | 0.000 | 0.000 | 0.082 | 99.918 |
| Con Dao | 0.000 | 0.000 | 0.000 | 0.000 | 0.000 | 0.000 | 9.928 | 90.072 |
| Kon Ka Kinh | 0.000 | 0.000 | 0.000 | 0.000 | 0.000 | 0.000 | 0.865 | 99.135 |
| Lo Go - Xa Mat | 0.000 | 0.001 | 0.005 | 0.005 | 0.013 | 1.321 | 59.968 | 38.687 |
| Mui Ca Mau | 0.000 | 0.000 | 0.000 | 0.000 | 0.001 | 0.442 | 16.413 | 83.144 |
| Phu Quoc | 0.000 | 0.000 | 0.000 | 0.000 | 0.000 | 0.142 | 22.698 | 77.160 |
| Phuoc Binh | 0.000 | 0.000 | 0.000 | 0.001 | 0.002 | 1.992 | 70.258 | 27.747 |
| Tram Chim | 0.000 | 0.000 | 0.000 | 0.002 | 0.002 | 1.324 | 56.475 | 42.197 |
| U Minh Ha | 0.000 | 0.000 | 0.000 | 0.000 | 0.000 | 0.014 | 3.653 | 96.333 |
| U Minh Thuong | 0.000 | 0.000 | 0.000 | 0.000 | 0.000 | 0.321 | 49.391 | 50.288 |
| Vu Quang | 0.000 | 0.000 | 0.000 | 0.001 | 0.002 | 0.260 | 24.251 | 75.486 |
| Xuan Son | 0.000 | 0.000 | 0.000 | 0.000 | 0.000 | 0.000 | 3.279 | 96.721 |
| Xuan Thuy | 0.000 | 0.000 | 0.004 | 0.042 | 0.118 | 11.576 | 77.054 | 11.206 |
| Yok Don | 0.000 | 0.000 | 0.000 | 0.000 | 0.003 | 2.734 | 82.545 | 14.718 |
Since 18 NPs were dominated (Table

The importance of criteria supporting particular national parks. The heat map represents the average proportional relative importance of each criterion to a national park supporter, with the scale ranging from green (the least important) to red (the most important).
| National park | IN | BD | RR | HS | HH | IS | TR | TC | EC | DA | EA | IA | LC |
|---|---|---|---|---|---|---|---|---|---|---|---|---|---|
| Phong Nha – Ke Bang | 2 | 10 | 4 | 7 | 11 | 12 | 13 | 5 | 3 | 6 | 1 | 9 | 8 |
| Cuc Phuong | 13 | 4 | 11 | 7 | 3 | 2 | 1 | 5 | 10 | 9 | 12 | 6 | 8 |
| Ba Be | 2 | 11 | 5 | 6 | 4 | 1 | 3 | 13 | 9 | 10 | 12 | 8 | 7 |
| Hoang Lien | 11 | 4 | 6 | 7 | 12 | 9 | 1 | 8 | 3 | 10 | 2 | 13 | 5 |
| Bidoup-Nui Ba | 2 | 8 | 10 | 13 | 9 | 12 | 1 | 6 | 7 | 11 | 3 | 5 | 4 |
| Tam Dao | 11 | 9 | 6 | 4 | 8 | 3 | 1 | 10 | 13 | 7 | 2 | 5 | 12 |
| Cat Ba | 4 | 10 | 11 | 6 | 7 | 8 | 1 | 13 | 9 | 2 | 3 | 5 | 12 |
| Cat Tien | 2 | 8 | 12 | 13 | 9 | 1 | 11 | 7 | 3 | 5 | 10 | 4 | 6 |
| Nui Chua | 10 | 8 | 12 | 8 | 6 | 5 | 1 | 11 | 7 | 13 | 2 | 3 | 4 |
| Chu Yang Sin | 9 | 11 | 2 | 3 | 9 | 13 | 1 | 7 | 6 | 5 | 11 | 8 | 4 |
| Ba Vi | 10 | 8 | 10 | 6 | 7 | 10 | 2 | 8 | 1 | 4 | 5 | 2 | 10 |
| Pu Mat | 1 | 4 | 12 | 5 | 7 | 3 | 2 | 6 | 10 | 7 | 7 | 12 | 10 |
Spearman’s rank correlation coefficient was employed to assess the correlation between tourism attractiveness and the number of tourists who visited the NPs. The comparison was carried out for only 26 NPs due to a lack of data on the number of tourists of four NPs (Table
Discussion
National parks in Vietnam are an essential part of the national development strategy for the countryside, as well as nature protection (
The present study explores some of the attributes and characteristics of NPs associated with the initial evaluation of tourism attractiveness and destinations in 30 Vietnamese NPs. The findings not only contribute to a deeper understanding of the managerial context of NPs, but also provide information on the performance appraisal of NPs with regard to tourism. The study highlights the relative importance of attributes with regard to the tourism attractiveness of NP-based destinations and orders them into a ranking system.
The ranking of the national parks by the SMAA and PROMETHEE model suggests a degree of competition exists regarding the tourism attractiveness and tourism performance of protected areas. Our present findings indicate that Phong Nha - Ke Bang NP has the most competitive position. Phong Nha - Ke Bang is situated in Central Vietnam, 40km north of Dong Hoi City (Quang Binh Province) and 500km south of Ha Noi City, and possesses outstanding historical and cultural resources such as cave systems and indigenous groups (
The competitiveness of NPs in Vietnam appears uneven: while the three best NPs (Phong Nha – Ke Bang, Cuc Phuong, and Ba Be) were the most attractive for 95% of potential tourists, 60% of NPs were dominated by the best NPs and were not able to compete effectively with them. According to the Vietnam tourism master plan until 2020 (
It was found that each criterion (attribute) contributed a different value towards the attractiveness of the 12 non-dominated NPs (Figure
The trail criterion identified in the present findings plays a crucial role for supporters of most non-dominated parks; hence the trail attribute appears to be the most important of the recreation facilities affecting forest-based tourism attractiveness (
Moreover, it was found that other criteria with discriminating power were its international importance -this being the most important criterion for Pu Mat. Information services was a significant criterion for Ba Be, Cat Tien and Cuc Phuong. Education and research cooperation was the most important criterion for Ba Vi, and external access was the important criterion for Phong Nha - Ke Bang, Hoang Lien, Tam Dao and Nui Chua (Table
Our present findings also suggest that the development of NP-based tourism destinations in Vietnam is uneven. In particular, the development of tourism in protected areas, where most NPs suffer from a lack of services and facilities for tourism, is faced by multiple challenges; several NPs are characterised by logging and unavailable trails (see Appendix 2). The issues are similar to those identified by the
The tourism attractiveness of a NP, i.e. its attractiveness to tourists, significantly correlated with the number of tourists visiting it. This was consistent with the result for Phong Nha - Ke Bang NP, which was rated as the most attractive park and attracted the highest number of tourists in 2015 (Table
In addition to its methodological qualities, the results indicate that integrating the SMAA and PROMETHEE methods could serve as a useful approach for supporting decision making when ranking NP-based tourism destinations, and provide decision makers with information for determining the position of a destination. However, it may not be realistic to develop a decision model that fits all decision makers and every decision situation (
In trying to evaluate the attractiveness and the performance of 30 Vietnamese NPs in the context of NBT management, the present study was limited to criteria that are easily measured. Other attributes of a protected area, such as image, climatic phenomena, landscapes and scenery, can be assumed to affect the tourism attractiveness and destination choice (
Furthermore, the present study lacks the perspective of decision makers or different stakeholders; for example, domestic and foreign tourists who not only directly use the natural resources of a NP but also can evaluate its attributes as a destination (
These approaches raise some key questions, e.g. how to use potential NP attributes to attract tourists, how to determine the attractiveness of NP-based tourism, how to involve stakeholders and evaluate their role in the tourism management of NPs, how NBT can be developed while maintaining a high level of ecosystem and biodiversity. Although the precise answers to these questions remain unclear, the approach taken in the present study is an effective method of evaluating the characteristics of NPs and their tourism performance. Such evaluation represents a crucial step in addressing these questions, as well as in improving the effective management of protected areas. Taking this approach will allow more effective planning and development of protected area-based tourism and sustainable tourism in Vietnam.
Conclusion
SMAA and PROMETHEE have been widely applied to deal with various real-world problems (
Acknowledgments
The authors would like to thank the managers of Vietnam’s national parks who gave time to respond to the survey. We would also like to thank the editor and reviewers for their useful comments and discussion on the manuscript.
References
- American Museum of Natural History (2003) Tiger in the forest: Sustainable nature-based tourism in Southeast Asia. American Museum of Natural History, New York. https://www.amnh.org/content/download/135862/2233504/file/2003%20Symposium%20Program.pdf
- An LT, Markowski J, Bartos M (2018) The comparative analyses of selected aspects of conservation and management of Vietnam’s national parks. Nature Conservation 25: 1–30. https://doi.org/10.3897/natureconservation.25.19973
- Backman SJ, Uysal M, Backman K (1991) Regional analysis of tourism resources. Annals of Tourism Research 8(2): 323–327. https://doi.org/10.1016/0160-7383(91)90016-5
- Ballantyne R, Packer J, Hughes K (2009) Tourists’ support for conservation messages and sustainable management practices in wildlife tourism experiences. Tourism Management 30(5): 658–664. https://doi.org/10.1016/j.tourman.2008.11.003
- Balmford A, Beresford J, Green J, Naidoo R, Walpole M, Manica A (2009) A global perspective on trends in nature-based tourism. PLoS Biology 7(6): e1000144. https://doi.org/10.1371/journal.pbio.1000144
- Balmford A, Green JMH, Anderson M, Beresford J, Huang C, Naidoo R, Walpole M, Manica A (2015) Walk on the wild side: Estimating the global magnitude of visits to protected areas. PLoS Biology 13(2): e1002074. https://doi.org/10.1371/journal.pbio.1002074
- Bookbinder MP, Dinerstein E, Rijal A, Cauley H, Rajouria A (1998) Ecotourism’s support of biodiversity conservation. Conservation Biodiversity 12(6): 1399–1404.
- Brans JP, Mareschal B (1994) The PROMCALC&GAIA decision support system for multi-criteria decision aid. Decision Support Systems 12(4–5): 297–310. https://doi.org/10.1016/0167-9236(94)90048-5
- Brans JP, Mareschal B (2005) PROMETHEE methods. In: Figueira J, Greco S, Ehrgott M (Eds) Multiple Criteria Decision Analysis: State of the Art Surveys.Springer, Boston, 163–195. https://doi.org/10.1007/0-387-23081-5_5
- Brans JP, Vincke PH (1985) A preference ranking organization method. Management Science 31(6): 647–656. https://doi.org/10.1287/mnsc.31.6.647
- Brown K, Adger WN, Tompkins E, Bacon P, Shim D, Young K (2001) Trade-off analysis for marine protected area management. Ecological Economics 37(3): 417–434. https://doi.org/10.1016/S0921-8009(00)00293-7
- Buhalis D (2000) Marketing the competitive destination of the future. Tourism Management 21(1): 97–116. https://doi.org/10.1016/S0261-5177(99)00095-3
- Carey S, Gountas Y, Gilbert D (1997) Tour operators and destination sustainability. Tourism Management 18(7): 425–431. https://doi.org/10.1016/S0261-5177(97)00044-7
- Castro EV, Souza TB, Thapa B (2015) Determinants of tourism attractiveness in the national parks of Brazil. Parks Journal 21(2): 51–62.
- Cavlek N (2002) Tour operators and destination safety. Annals of Tourism Research 29(2): 478–496. https://doi.org/10.1016/S0160-7383(01)00067-6
- Cooper C, Fletcher J, Gilbert D, Wanhill S (1993) Tourism: Principles and Practice. Longman Group Limited, Harlow.
- Corrente S, Figueira JR, Greco S (2014) The SMAA-PROMETHEE method. European Journal of Operational Research 239(2): 514–522. https://doi.org/10.1016/j.ejor.2014.05.026
- Deng J, King B, Bauer T (2002) Evaluating natural attractions for tourism. Annals of Tourism Research 29(2): 422–438. https://doi.org/10.1016/S0160-7383(01)00068-8
- Dodds R, Graci SR, Holmes M (2010) Does the tourist care? A comparison of tourists in Koh Phi Phi, Thailand and Gili Trawangan, Indonesia. Journal of Sustainable Tourism 18(2): 207–222. https://doi.org/10.1080/09669580903215162
- Dwyer L, Kim C (2003) Destination competitiveness: Determinants and indicators. Current Issues in Tourism 6(5): 369–414. https://doi.org/10.1080/13683500308667962
- Eagles PFJ (2002) Trends in park tourism: Economics, finance and management. Journal of Sustainable Tourism 10(2): 132–153. https://doi.org/10.1080/09669580208667158
- Eagles PFJ, Bowman ME, Tao TC-H (2001) Guidelines for tourism in parks and protected areas of East Asia. IUCN, Gland and Cambridge, 99 pp.
- Eagles PFJ, McCool SF, Haynes CD (2002) Sustainable tourism in protected areas: Guidelines for planning and management. IUCN, Gland and Cambridge, 183 pp.
- Erb M (2015) Sailing to Komodo: Contradictions of tourism and development in eastern Indonesia. ASEAS – Austrian. Journal of Southeast Asian Studies 8(2): 143–164.
- Figueira J, Greco S, Ehrgott M [Eds] (2005) Multiple criteria decision analysis: State of the art surveys. Springer, New York. https://doi.org/10.1007/b100605
- Findlay C, Southwell K (2004) ‘I just followed my nose’: Understanding visitor wayfinding and information needs at forest recreation sites. Managing Leisure 9(4): 227–240. https://doi.org/10.1080/1360671042000317261
- Formica S, Uysal M (2006) Destination attractiveness based on supply and demand evaluations: An analytical framework. Journal of Travel Research 44(4): 418–430. https://doi.org/10.1177/0047287506286714
- Goodwin H (1996) In pursuit of ecotourism. Biodiversity and Conservation 5(3): 277–291. https://doi.org/10.1007/BF00051774
- Goodwin H (2002) Local community involvement in tourism around national parks: Opportunities and constraints. Current Issues in Tourism 5(3–4): 338–360. https://doi.org/10.1080/13683500208667928
- GoV [Government of Vietnam] (2010) Decree No. 117/2010/ND-CP of the Government dated 24 December 2010 on the organization and management of the system of special use forest in Vietnam. Government of Vietnam, Hanoi.
- GoV [Government of Vietnam] (2013) Decision No. 201/2013/QD-TTg of the Prime Minister dated 22 January 2013 on the approval of the master plan on Viet Nam tourism development to 2020, and a vision 2030. Government of Vietnam, Hanoi.
- GoV [Government of Vietnam] (2014) Decision No. 1976/2014/QD-TTg of the Prime Minister dated 30 October 2014 on the approval of the planning for special use forest system to 2020, and a vision to 2030. Government of Vietnam, Hanoi.
- Greco S, Ehrgott M, Figueira J (Eds) (2016) Multiple criteria decision analysis: State of the art surveys (2nd edn). Springer, New York. https://doi.org/10.1007/978-1-4939-3094-4
- Higgins BR (1996) The global structure of the nature tourism industry: Ecotourists, tour operators, and local businesses. Journal of Travel Research 35(2): 11–18. https://doi.org/10.1177/004728759603500203
- Hong PN, Quan TQD, Thoa LK (2002) Ecotourism in Vietnam: Potential and reality. Kyoto Review of Southeast Asia 2. https://kyotoreview.org/issue-2-disaster-and-rehabilitation/ecotourism-in-vietnam-potential-and-reality
- Hsu T-K, Tsai Y-F, Wu H-H (2009) The preference analysis for tourist choice of destination: A case study of Taiwan. Tourism Management 30(2): 288–297. https://doi.org/10.1016/j.tourman.2008.07.011
- Hung NT (1998) Ecotourism development in Vietnam – A sustainable development perspective. Workshop on Role of Ecotourism in Sustainable Tourism Development in Vietnam, Hanoi (Vietnam), April 1998. Vietnam Tourism Administration, Hanoi.
- Hyde K, Maier HR, Colby C (2003) Incorporating uncertainty in the PROMETHEE MCDA method. Journal of Multi-Criteria Decision Analysis 12(4–5): 245–259. https://doi.org/10.1002/mcda.361
- ICEM [International Centre for Environmental Management] (2003) Vietnam national report on protected areas and development. Review of protected areas and development in the Lower Mekong River Region. International Centre for Environmental Management (Indooroopilly, Queensland): 1–60.
- Ishizaka A, Nemery P (2013) Multi-criteria decision analysis: Methods and software. Wiley (Chichester). https://doi.org/10.1002/9781118644898
- IUCN [International Union for Conservation of Nature UNEP-WCMC – United Nations Environment Programme World Conservation Monitoring Centre] (2017) The World Database on Protected Areas (WDPA), February 2017. UNEP-WCMC, Cambridge. https://www.protectedplanet.net
- Jansen-Verbeke M, Go F (1995) Tourism development in Vietnam. Tourism Management 6(4): 315–321. https://doi.org/10.1016/0261-5177(95)97356-U
- Kim D, Perdue RR (2011) The influence of image on destination attractiveness. Journal of Travel & Tourism Marketing 28(3): 225–239. https://doi.org/10.1080/10548408.2011.562850
- Kim SS, Lee C-K, Klenosky DB (2003) The influence of push and pull factors at Korean national parks. Tourism Management 24(2): 169–180. https://doi.org/10.1016/S0261-5177(02)00059-6
- Kovačić M (2010) Selecting the location of a nautical tourism port by applying PROMETHEE and GAIA methods. Promet – Traffic&Transportation 22(5): 341–351. https://doi.org/10.7307/ptt.v22i5.199
- Kruger M, Saayman M (2010) Travel motivation of tourists to Tsitsikamma and Kruger National Parks. South African Journal of Wildlife Research 40(1): 93–102. https://doi.org/10.3957/056.040.0106
- Lahdelma R, Salminen P (2001) SMAA-2: Stochastic multicriteria acceptability analysis for group decision making. Operations Research 49(3): 444–454. https://doi.org/10.1287/opre.49.3.444.11220
- Lahdelma R, Salminen P (2010) Stochastic multicriteria acceptability analysis (SMAA). In: Ehrgott M, Figueira JR, Greco S (Eds) Trends in multiple criteria decision analysis.Springer, New York, 285–315. https://doi.org/10.1007/978-1-4419-5904-1_10
- Lahdelma R, Hokkanen J, Salminen P (1998) SMAA – stochastic multiobjective acceptability analysis. European Journal of Operational Research 106(1): 137–143. https://doi.org/10.1016/S0377-2217(97)00163-X
- Lahdelma R, Salminen P, Hokkanen J (2000) Using multicriteria methods in environmental planning and management. Environmental Management 26(6): 595–605. https://doi.org/10.1007/s002670010118
- Le Van Minh (2016) Tiềm năng phát triển du lịch sinh thái tại Việt Nam [Potential ecotourism development in Vietnam]. Vietnam Environment Administration Magazine 6: 28–29. http://tapchimoitruong.vn/Lists/Journals/Attachments/1164/S%E1%BB%91%206%20full.pdf.pdf [In Vietnamese]
- Lee C-F, Huang H-I, Yeh H-R (2010) Developing an evaluation model for destination attractiveness: Sustainable forest recreation tourism in Taiwan. Journal of Sustainable Tourism 18(6): 811–828. https://doi.org/10.1080/09669581003690478
- Leiper N (1990) Tourist attraction systems. Annals of Tourism Research 17(3): 367–384. https://doi.org/10.1016/0160-7383(90)90004-B
- Luong PT (1999) Current situation, potential and orientation on ecotourism development in Vietnam. In: Luong PT, Annalisa K, Lan NT, Cuong NDH, Cam HD (Eds) Proceedings, Workshop on Development of a National Ecotourism Strategy for Vietnam, Hanoi (Vietnam), September 1999. Institute for Tourism Development Research and IUCN, Hanoi.
- Luzar EJ, Diagne A, Gan C, Henning BR (1995) Evaluating nature-based tourism using the new environmental paradigm. Journal of Agricultural and Applied Economics 27(2): 544–555. https://doi.org/10.1017/S1074070800028571
- Manning RE, Anderson LE (2012) Managing outdoor recreation: Case studies in the national parks. CABI, Wallingford. https://doi.org/10.1079/9781845939311.0000
- Mayo EJ, Jarvis LP (1981) The psychology of leisure travel: Effective marketing and selling of travel service. CBI, Boston.
- Michailidis A, Chatzitheodoridis F (2006) Scenarios analysis of tourism destinations. Journal of Social Sciences 2(2): 41–47. https://doi.org/10.3844/jssp.2006.41.47
- MONRE [Ministry of Natural Resources and Environment] (2011) National report on Biodiversity Year 2011. Ministry of Natural Resources and Environment, Hanoi.
- MONRE [Ministry of Natural Resources and Environment] (2014) Vietnam’s fifth national report to the United Nations Convention on biological diversity: Reporting period 2009–2013. Ministry of Natural Resources and Environment, Hanoi.
- Morrison AM (2013) Marketing and managing tourism destinations. Routledge (London). https://doi.org/10.4324/9780203081976
- Muszyńka-Kurnik M (2012) Atrakcyjność rekreacyjno-turystyczna Gorczańskiego Parku Narodowego [The recreational-touristic attractiveness of the Gorczński (Gorce) National Park]. International Conference on the Development of Cultural and Natural Tourism in the Polish-Slovak border, Nowy Targ (Poland), April 2012. http://www.konferencja.ppwsz.edu.pl/_pliki/09-muszynska,5b825.pdf [In Polish]
- Öztürk M, Tsoukiàs A, Vincke P (2005) Preference modelling. In: Figueira J, Greco S, Ehrgott M (Eds) Multiple criteria decision analysis: State of the art surveys.Springer, New York, 27–71. https://doi.org/10.1007/0-387-23081-5_2
- Palmer C (1999) Tourism and the symbols of identity. Tourism Management 20(3): 313–321. https://doi.org/10.1016/S0261-5177(98)00120-4
- PARC Project (2006) Policy Brief: Building Viet Nam’s national protected areas system – policy and institutional innovations required for progress. Creating Protected Areas for Resource Conservation using Landscape Ecology (PARC) Project VIE/95/G31&031, FPD/UNOPS/UNDP/IUCN, Hanoi.
- Phumsathan S (2010) Environmental impacts of tourism in Khao Yai national park, Thailand. PhD Thesis. Texas A&M University, Texas. http://hdl.handle.net/1969.1/ETD-TAMU-2010-08-8223
- Prideaux B (2000) The role of the transport system in destination development. Tourism Management 21(1): 53–63. https://doi.org/10.1016/S0261-5177(99)00079-5
- Puustinen J, Pouta E, Neuvonen M, Sieväänen T (2009) Visits to national parks and the provision of natural and man-made recreation and tourism resources. Journal of Ecotourism 8(1): 18–31. https://doi.org/10.1080/14724040802283210
- R Core Team (2017) . R: A language and environment for statistical computing. R Foundation for Statistical Computing, Vienna. https://www.R-project.org
- Ranjan R, Chatterjee P, Chakraborty S (2016) Performance evaluation of Indian states in tourism using an integrated PROMETHEE-GAIA approach. OPSEARCH 53(1): 63–84. https://doi.org/10.1007/s12597-015-0225-6
- Reynolds PC, Braithwaite D (2001) Towards a conceptual framework for wildlife tourism. Tourism Management 22(1): 31–42. https://doi.org/10.1016/S0261-5177(00)00018-2
- Rugendyke B, Son NT (2005) Conservation costs: Nature-based tourism as development at Cuc Phuong national park, Vietnam. Asia Pacific Viewpoint 46(2): 185–200. https://doi.org/10.1111/j.1467-8373.2005.00265.x
- Saayman M, Saayman A (2009) Why travel motivations and socio-demographics matter in managing a National Park. Koedoe 51(1): a381. https://doi.org/10.4102/koedoe.v51i1.381
- Schägner JP, Brander L, Maes J, Paracchini ML, Hartje V (2016) Mapping recreational visits and values of European national parks by combining statistical modelling and unit value transfer. Journal for Nature Conservation 31: 71–84. https://doi.org/10.1016/j.jnc.2016.03.001
- Secretariat ASEAN (2016) ASEAN brand awareness survey 2015–2016. Association of Southeast Asian Nations (ASEAN) Secretariat, Jakarta. http://asean.org/storage/2012/05/FINAL-THE-BOOK-ASEAN-BAS-2015-2016.pdf
- Sigala M (2008) A supply chain management approach for investigating the role of tour operators on sustainable tourism: The case of TUI. Journal of Cleaner Production 16(15): 1589–1599. https://doi.org/10.1016/j.jclepro.2008.04.021
- Sirakaya E, Woodside AG (2005) Building and testing theories of decision making by travelers. Tourism Management 26(6): 815–832. https://doi.org/10.1016/j.tourman.2004.05.004
- Spenceley A, Kohl J, McArthur S, Myles P, Notarianni M, Paleczny D, Pickering C, Worboys GL (2015) Visitor management. In: Worboys GL, Lockwood M, Kothari A, Feary S, Pulsford I (Eds) Protected area governance and management.ANU Press, Canberra, 715–750.
- Steven R, Pickering C, Castley JG (2011) A review of the impacts of nature based recreation on birds. Journal of Environmental Management 92(10): 2287–2294. https://doi.org/10.1016/j.jenvman.2011.05.005
- Suntikul W, Butler R, Airey D (2010) Implications of political change on national park operations: Doi moi and tourism to Vietnam’s national parks. Journal of Ecotourism 9(3): 201–218. https://doi.org/10.1080/14724040903144360
- Tervonen T, Figueira JR (2008) A survey on stochastic multicriteria acceptability analysis methods. Journal of Multi-Criteria Decision Analysis 15(1–2): 1–14. https://doi.org/10.1002/mcda.407
- UNESCO – United Nations Educational, Scientific and Cultural Organization (2014) Phong Nha – Ke Bang National Park, Quang Binh, Vietnam: Renomination expanding criterion (VIII) and inscription on criteria (IX) and (X). http://whc.unesco.org/uploads/nominations/951bis.pdf
- Yan C, Morrison AM (2008) The influence of visitors´ awareness of world heritage listings: A case study of Huangshan, Xidi and Hongan in Southern Anhui, China. Journal of Heritage Tourism 2(3): 184–195. https://doi.org/10.2167/jht059.0
Appendix 1
Types of generalized criteria and their corresponding preference functions. Source: Adapted to
| Name of the Criterion | Preference function | Parameters | |
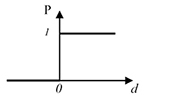
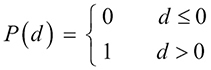
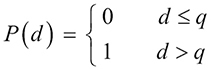
| Type 1: Usual Criterion |
|
|
None |
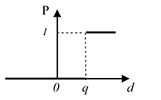
| Type 2: U-shape Criterion |
|
|
q |
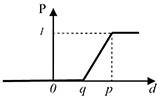
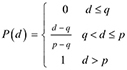
| Type 3: V-shape Criterion with linear preference |
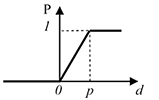
|
|
p |
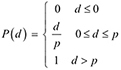
| Type 4: Level Criterion |

|
|
p, q |
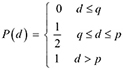
| Type 5: V-shape Criterion with indifference and linear preference |
|
|
p, q |
| Type 6: Gaussian Criterion |
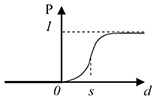
|
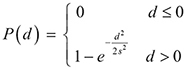
|
s |
Appendix 2
Decision matrix for the tourism performance appraisal of Vietnamese national parks. List of abbreviations: IN: International importance; BD: Biodiversity of plants and animals; RR: Rare plants and animals; HS: Historical, cultural and spiritual structures; HH: Hotels & hostels; IS: Information services; TR: Trails; TC: Tourism cooperation; EC: Education & research cooperation; DA: Diversity of outdoor activities; EA: External assess; IA: Internal access; LC: Local community.
| National park | Criteria | ||||||||||||
|---|---|---|---|---|---|---|---|---|---|---|---|---|---|
| IN* | BD** | RR** | HS* | HH* | IS* | TR* | TC* | EC* | DA* | EA* | IA* | LC* | |
| Ba Be | 1 | 2536 | 153 | 1 | 300 | 7 | 9 | 5 | 9 | 7 | 2 | 1 | 1 |
| Ba Vi | 0 | 3075 | 137 | 1 | 160 | 4 | 6 | 5 | 10 | 9 | 3 | 1 | 0 |
| Bach Ma | 0 | 3669 | 148 | 1 | 44 | 4 | 7.7 | 1 | 5 | 5 | 2 | 1 | 0 |
| Bai Tu Long | 0 | 1111 | 108 | 0 | 0 | 7 | 0 | 0 | 4 | 5 | 3 | 1 | 0 |
| Ben En | 0 | 2734 | 94 | 1 | 160 | 6 | 5 | 0 | 2 | 6 | 3 | 0 | 0 |
| Bidoup-Nui Ba | 1 | 2680 | 109 | 0 | 60 | 4 | 41.1 | 8 | 6 | 6 | 3 | 1 | 1 |
| Bu Gia Map | 0 | 1874 | 97 | 1 | 48 | 5 | 39.5 | 0 | 5 | 5 | 1 | 1 | 1 |
| Cat Ba | 1 | 2329 | 94 | 1 | 256 | 6 | 24.3 | 0 | 7 | 11 | 3 | 1 | 0 |
| Cat Tien | 1 | 3139 | 117 | 0 | 130 | 7 | 0 | 28 | 12 | 9 | 2 | 1 | 1 |
| Chu Mom Ray | 0 | 2142 | 81 | 0 | 0 | 3 | 0 | 0 | 0 | 2 | 2 | 0 | 0 |
| Chu Yang Sin | 0 | 1402 | 106 | 1 | 0 | 2 | 78 | 1 | 0 | 6 | 2 | 0 | 1 |
| Con Dao | 0 | 1212 | 28 | 0 | 48 | 4 | 8.4 | 1 | 3 | 6 | 1 | 0 | 0 |
| Cuc Phuong | 0 | 4510 | 125 | 1 | 380 | 7 | 35 | 50 | 8 | 9 | 2 | 1 | 1 |
| Hoang Lien | 0 | 3795 | 150 | 1 | 40 | 6 | 27 | 26 | 10 | 7 | 3 | 0 | 1 |
| Kon Ka Kinh | 0 | 1578 | 69 | 0 | 0 | 3 | 0 | 0 | 1 | 1 | 3 | 0 | 0 |
| Lo Go - Xa Mat | 0 | 1236 | 35 | 1 | 20 | 4 | 60 | 0 | 3 | 6 | 3 | 0 | 0 |
| Mui Ca Mau | 1 | 439 | 28 | 1 | 0 | 2 | 0 | 0 | 0 | 7 | 1 | 0 | 1 |
| Nui Chua | 0 | 1834 | 76 | 0 | 60 | 5 | 46 | 7 | 3 | 4 | 3 | 1 | 1 |
| Phong Nha – Ke Bang | 1 | 3774 | 195 | 1 | 170 | 6 | 0 | 300 | 13 | 10 | 3 | 1 | 1 |
| Phu Quoc | 1 | 1561 | 65 | 1 | 0 | 0 | 0 | 0 | 7 | 6 | 1 | 0 | 0 |
| Phuoc Binh | 0 | 1552 | 86 | 0 | 50 | 2 | 3 | 10 | 4 | 4 | 3 | 0 | 1 |
| Pu Mat | 1 | 3764 | 150 | 1 | 72 | 7 | 15 | 2 | 5 | 5 | 1 | 0 | 0 |
| Tam Dao | 0 | 2581 | 148 | 1 | 120 | 7 | 44 | 5 | 0 | 7 | 3 | 1 | 0 |
| Tram Chim | 1 | 545 | 52 | 0 | 24 | 2 | 0 | 2 | 4 | 6 | 3 | 1 | 0 |
| U Minh Ha | 1 | 374 | 28 | 0 | 30 | 2 | 0 | 0 | 3 | 4 | 3 | 0 | 0 |
| U Minh Thuong | 1 | 682 | 40 | 0 | 20 | 3 | 5 | 3 | 5 | 5 | 2 | 1 | 0 |
| Vu Quang | 1 | 2508 | 184 | 0 | 0 | 1 | 0 | 0 | 4 | 3 | 2 | 0 | 0 |
| Xuan Son | 0 | 2226 | 117 | 0 | 0 | 4 | 0 | 0 | 0 | 3 | 2 | 0 | 0 |
| Xuan Thuy | 1 | 756 | 11 | 1 | 30 | 5 | 0 | 15 | 9 | 5 | 2 | 1 | 0 |
| Yok Don | 0 | 1388 | 80 | 0 | 42 | 6 | 39 | 5 | 0 | 5 | 2 | 1 | 1 |
Appendix 3
| Criteria | Value | Preference function | q | p | Max/Min |
|---|---|---|---|---|---|
| International designation | 1 = Yes, 0 = No | Usual | 0 | 1 | Max |
| Biodiversity of plants and animals | Numeric variables | Linear | 0 | 4136 | Max |
| Rare plants and animals | Numeric variables | Linear | 0 | 184 | Max |
| Historical, cultural and spiritual structures | 1 = Yes, 0 = No | Usual | 0 | 1 | Max |
| Hotels & hostels | Numeric variables | Linear | 0 | 380 | Max |
| Information services | Numeric variables | Linear | 0 | 7 | Max |
| Trails | Numeric variables | Linear | 0 | 78 | Max |
| Tourism cooperation | Numeric variables | Linear | 0 | 25 | Max |
| Education & research cooperation | Numeric variables | Linear | 0 | 13 | Max |
| Diversity of outdoor activities | Numeric variables | Linear | 0 | 10 | Max |
| External access | 3 = Short, 2 = Medium, 1 = Large | Level | 0 | 1 | Max |
| Internal assess | 1 = Yes, 0 = No | Usual | 0 | 1 | Max |
| Local community | 1 = Yes, 0 = No | Usual | 0 | 1 | Max |
Appendix 4
Central weight vectors. List of abbreviations: IN: International importance; BD: Biodiversity of plants and animals; RR: Rare plants and animals; HS: Historical, cultural and spiritual structures; HH: Hotels & hostels; IS: Information services; TR: Trails; TC: Tourism cooperation; EC: Education & research cooperation; DA: Diversity of outdoor activities; EA: External assess; IA: Internal access; LC: Local community.
| National park | IN | BD | RR | HS | HH | IS | TR | TC | EC | DA | EA | IA | LC |
|---|---|---|---|---|---|---|---|---|---|---|---|---|---|
| Phong Nha – Ke Bang | 0.085 | 0.077 | 0.084 | 0.077 | 0.073 | 0.066 | 0.048 | 0.081 | 0.085 | 0.081 | 0.088 | 0.077 | 0.077 |
| Cuc Phuong | 0.034 | 0.094 | 0.049 | 0.078 | 0.095 | 0.103 | 0.139 | 0.080 | 0.058 | 0.074 | 0.041 | 0.079 | 0.077 |
| Ba Be | 0.128 | 0.032 | 0.089 | 0.081 | 0.090 | 0.131 | 0.125 | 0.032 | 0.060 | 0.044 | 0.032 | 0.077 | 0.079 |
| Hoang Lien | 0.029 | 0.088 | 0.083 | 0.081 | 0.022 | 0.053 | 0.187 | 0.063 | 0.093 | 0.048 | 0.145 | 0.020 | 0.087 |
| Bidoup-Nui Ba | 0.125 | 0.049 | 0.041 | 0.027 | 0.042 | 0.030 | 0.249 | 0.055 | 0.050 | 0.038 | 0.123 | 0.083 | 0.089 |
| Tam Dao | 0.037 | 0.043 | 0.077 | 0.081 | 0.048 | 0.108 | 0.235 | 0.040 | 0.018 | 0.056 | 0.152 | 0.081 | 0.024 |
| Cat Ba | 0.115 | 0.031 | 0.023 | 0.086 | 0.083 | 0.053 | 0.170 | 0.016 | 0.050 | 0.136 | 0.128 | 0.087 | 0.020 |
| Cat Tien | 0.112 | 0.050 | 0.019 | 0.012 | 0.036 | 0.323 | 0.024 | 0.070 | 0.098 | 0.076 | 0.026 | 0.077 | 0.075 |
| Nui Chua | 0.014 | 0.020 | 0.008 | 0.020 | 0.060 | 0.080 | 0.398 | 0.012 | 0.024 | 0.008 | 0.136 | 0.112 | 0.108 |
| Chu Yang Sin | 0.015 | 0.005 | 0.090 | 0.075 | 0.015 | 0.000 | 0.595 | 0.030 | 0.035 | 0.040 | 0.005 | 0.025 | 0.070 |
| Ba Vi | 0.010 | 0.020 | 0.010 | 0.080 | 0.060 | 0.010 | 0.170 | 0.020 | 0.230 | 0.110 | 0.100 | 0.170 | 0.010 |
| Pu Mat | 0.250 | 0.130 | 0.000 | 0.120 | 0.020 | 0.150 | 0.200 | 0.070 | 0.010 | 0.020 | 0.020 | 0.000 | 0.010 |
Supplementary materials
Biodiversity in Vietnam’s national parks
Data type: species data
Rank acceptability indices for 30 national parks in Vietnam
Data type: species data