Review Article |
|
Corresponding author: Piia Lundberg ( piia.lundberg@helsinki.fi ) Academic editor: José M. Martínez-Paz
© 2022 Piia Lundberg, Anni Arponen.
This is an open access article distributed under the terms of the Creative Commons Attribution License (CC BY 4.0), which permits unrestricted use, distribution, and reproduction in any medium, provided the original author and source are credited.
Citation:
Lundberg P, Arponen A (2022) An overview of reviews of conservation flagships: evaluating fundraising ability and surrogate power. Nature Conservation 49: 153-188. https://doi.org/10.3897/natureconservation.49.81219
|
Abstract
The main role of flagship species in biodiversity conservation is to raise awareness and funds for conservation. Because of their marketing role, flagship species are often selected based on other than biodiversity related criteria, such as species charisma or aesthetic appeal. Nonetheless, funds raised through flagship species are often used to protect the species itself, making it important to evaluate the effectiveness of flagship species as conservation tools: For example, could superior fundraising ability outweigh the low biodiversity surrogate power of a flagship, justifying this ambivalent role in conservation? To assess flagship effectiveness from this dual perspective, we must synthesize evidence on a) the fundraising potential of flagship species vs. other conservation targets, such as ecosystems or biodiversity, and b) the biodiversity surrogate power of potential flagship taxa. We approached this broad topic through an overview of reviews on both subtopics. We found no evidence that charismatic flagship species were superior fundraisers over other conservation targets. In addition, studies evaluating the biodiversity surrogacy power of different taxa had mainly resulted in mixed findings, contesting the overall usefulness of the concept in conservation. The variability of study setups and methods made comparisons between studies difficult, highlighting the need to standardize future research (e.g., standardizing explanatory variables). Further possible reasons for lack of conclusive evidence on fundraising potential are the dominance of factors other than flagship identity (e.g., scope and conservation status) and differences in donor preferences. We recommend Environmental NGOs to develop and diversify their fundraising strategies based on best available knowledge, and rely less on mere species charisma.
Keywords
conservation fundraising, biodiversity surrogacy power, flagship species, flagship types, non-human charisma
Introduction
Halting the loss of biodiversity is a major conservation challenge in the 21st century, and the current pace shows no signs of improvement (Millennium Ecosystem
Surrogate species, to which flagship species also belong (Fig.
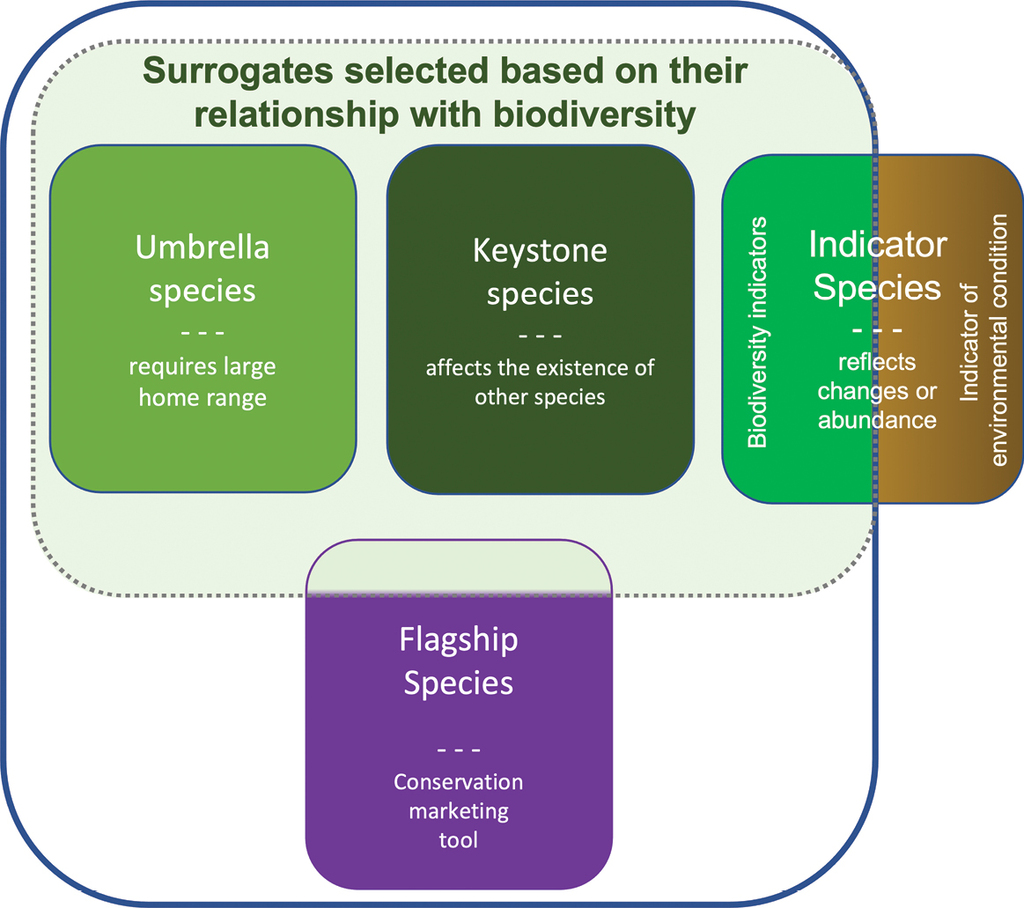
Examples of the most common surrogate types in conservation literature. Biodiversity surrogate types are in the middle of the image (the green area separated by a dashed line) and surrogate types discussed in this study are delimited within the blue line. Some of the flagship species also have significance as biodiversity surrogates and therefore belong to the green area, while others are being used ambiguously or purely for marketing purposes. Indicator species that are used to monitor the quality of the environment or changes in it are not included in biodiversity surrogates (the brown area) and our study.
This study addresses both biodiversity surrogates and flagships used in fundraising (Fig.
The goals of individual donors may differ from those of environmental non-governmental organizations (ENGOs), which further can differ from ecological criteria, but in this study, we evaluate the use of flagships from the perspective of effectiveness in biodiversity protection. Flagship species are broadly used by ENGOs in conservation fundraising (
To properly assess the usefulness of charismatic flagship species from this dual perspective, we need information on how the fundraising ability of flagship species compares to other potential conservation targets, such as flagship fleets, or “holistic” targets such as whole ecosystems, or biodiversity conservation. One way to evaluate the fundraising ability of different flagships is through willingness to pay (WTP) studies. Even though the WTP method represents hypothetical situations rather than real life and has its challenges (
To address such broad questions, an efficient strategy is to perform an overview of reviews, taking advantage of existing syntheses of literature that together cover a much larger selection of primary research than would be possible to cover otherwise in a single study (
To evaluate the fundraising ability and the surrogate power of different types of flagships, we searched for (1) meta-analyses of WTP for species, (2) meta-analyses of WTP for “holistic” conservation targets (ecosystems, biodiversity), and (3) meta-analyses of biodiversity surrogacy power studies (e.g., meta-analyses that evaluated how well some taxonomic group performed as surrogate species for other species or other taxonomic groups). In sum, we looked for evidence of effectiveness of concentrating conservation efforts on these charismatic flagship species.
Materials and methods
Literature for an overview of reviews
An overview of reviews (also called meta-review, review of reviews, umbrella review or meta-meta-analysis) is a synthesis over multiple systematic reviews (
Our study had two perspectives, namely WTP and biodiversity surrogacy power, and we conducted separate literature searches for each. First, we searched for papers that contained quantitative meta-analyses on individuals’ willingness to pay for conservation, addressing either species, ecosystems, or biodiversity. We used the search strings given in Suppl. material
In total, we found 12 meta-analyses related to willingness to pay that fulfilled our criteria. (Table
Data from meta-analyses on WTP and benefit transfer calculations for flagship types. All columns except the last one contain data extracted from the reviews. Benefit transfer error refers to the average difference between original data points and values predicted with the meta-regression models in the original meta-analyses. The following column contains a list of all covariates that were significant in the meta-regression model, and the values we used for them when calculating the benefit transfer estimates in the last column. Type of target is species (S), ecosystem or habitat type (E) or other holistic targets (H) such as biodiversity, wilderness etc. The last column contains the benefit transfer predictions of WTP we calculated for the various flagship types (“Predicted WTP in € (2019)”).
| Reference and model | Extent | n obs (studies) | R2 | Benefit transfer error | Significant covariates with value used in BT | Flagship type | Flagship | Predicted WTP in € (2019) | ||
|---|---|---|---|---|---|---|---|---|---|---|
| S | E | H | ||||||||
|
|
Global | 85 (53) | 0.716 | Not reported (an example of BT is provided but no assessment of error) | Resident = 1 | x | Charismatic terrestrial mammal | 35.56 | ||
| Payment vehicle = tax | x | Charismatic bird | 63.39 | |||||||
| Developing country = 0 | x | Charismatic fish | 28.89 | |||||||
| Response rate = 61% | x | Charismatic reptile | 34.72 | |||||||
| Sample size = 1713 | x | Non–charismatic terrestrial mammal | 52.89 | |||||||
| Only households in the study | x | Non–charismatic bird | 94.28 | |||||||
| x | Non–charismatic fish | 42.96 | ||||||||
| x | Non–charismatic reptile | 51.64 | ||||||||
|
|
USA | 67 (31) | 0.697 | Mean 34% for studies reporting an annual WTP value and 45% for studies reporting a lump sum WTP value | Contingent valuation = 1 | x | Charismatic terrestrial mammal (and reptile) | 81.92 | ||
| Change in population size = 50 | x | Charismatic Marine mammal | 177.28 | |||||||
| Resident = 1 (‘household’ assumed as opposed to ‘visitor’) | x | Charismatic Bird | 187.12 | |||||||
| Response rate = 0.491 | x | Charismatic Fish (but: fish and charisma were correlated) | 227.18 | |||||||
| Mail survey = 0.851 | x | Non–charismatic terrestrial mammal (and reptile) | 29.43 | |||||||
| Year = 2006 | x | Non–charismatic marine mammal | 63.67 | |||||||
| Only threatened / endangered species in the study | x | Non–charismatic bird | 67.21 | |||||||
| x | Non–charismatic fish | 81.59 | ||||||||
|
|
Global (US focus) | 54 (means from studies with multiple obs) | 0.37 | Not reported | Recurring payments = 1 | x | Charismatic (large eyed) terrestrial mammal | 2.00 | ||
| Negative economic impact of species = 0 | x | Charismatic marine mammal | 2.51 | |||||||
| Charisma based on eye size data from https://www.sciencedirect.com/science/article/pii/S0042698904001646, ‘large’ and ‘small’ = mean +– 1 SD | x | Charismatic bird | 1.79 | |||||||
| x | Charismatic fish | 0.29 | ||||||||
| x | Charismatic reptile | 0.06 | ||||||||
| x | Non–charismatic (small–eyed) terrestrial mammal | 1.35 | ||||||||
| x | Non–charismatic marine mammal | 1.69 | ||||||||
| x | Non–charismatic bird | 1.43 | ||||||||
| x | Non–charismatic fish | 0.21 | ||||||||
| x | Non–charismatic reptile | 0.05 | ||||||||
|
|
Asia & Oceania | 124 (16) | 0.82 0.459 | Median 16% | Dichotomous choice = 1 | x | Mammal | 28.17 (91.55 for mean household income in the US=$55000) | ||
| Household = 1 | ||||||||||
| Nonparametric = 0.07 | ||||||||||
| Mandatory (e.g. tax) = 1 | ||||||||||
| Income = USD 14 318 (or 55 000**) | ||||||||||
| Median 24% | Australia = 0 | x | Turtle | 2.29 (7.43) | ||||||
| Median 32% | Year = 2006 | x | Other | 6.30 (20.47) | ||||||
|
|
Asia & Oceania | 390 (67) | Median 46% | Contingent valuation = 1 | x | Terrestrial habitats | 4.58 | |||
| Median 40% | Monthly payment = 0 | x | Marine habitats | 7.97 | ||||||
| Median 71% | Nonparametric = 0.07 | x | (Wetlands not robust across models, possibly due to method used in wetland studies) | (15.47) | ||||||
| SE Asia = 0 | ||||||||||
| Median 36% | x | Mammal | 25.44 | |||||||
|
|
global, developed bias | 111 (max 46) | 0.08 | Not reported | Dichotomous choice = 1 | x | Specific habitat | 112.44 | ||
|
GDP = USD 34 614 (as in |
x | x | Other (Unspecific habitat or species) | 49.23 | ||||||
|
|
Europe, USA, Canada | 127 (22) | Level 1 0.6, Level 2 0.76 | Not reported | Choice experiment = 0 | x | Forest & freshwater preservation Scope high | 13.97 | ||
| Tax = 1 | x | Forest & freshwater preservation Scope low | 9.79 | |||||||
| Voluntary = 0 | x | Forest restoration: Scope high | 4.73 | |||||||
| Recurring payments = 1 | x | Forest restoration: Scope low | 3.32 | |||||||
| GDP PPP = $ 34 614 | ||||||||||
| USA = 0.362 | x | Freshwater restoration: Scope high | 7.35 | |||||||
| Year = 2006 | x | Freshwater restoration Scope low | 5.16 | |||||||
|
|
Fennoscandia | 250 (29) | 0.742 | Not reported | Use–related payment (recreational etc) = 0 | x | Forest: Full protection, avoid loss | 252.42 | ||
| Actual payment (ref: hypothetical) = 0 | x | Forest: Multi– use forestry, avoid loss | 321.95 | |||||||
| Household = 1 | x | Forest: Full protection, achieve gain | 196.23 | |||||||
| Response rate mail high = 0.13, medium = 0.25, low = 0.31 | ||||||||||
| MSc thesis = 0 | ||||||||||
| Unpublished = 0 | ||||||||||
| Size of good implicit (ref: explicitly given) = 0.78 | ||||||||||
|
|
Fennoscandia | 250 (29) | 0.742 | Not reported | Regional good = 0.21 | x | Forest: Multi– use forestry, achieve gain | 265.76 | ||
| Sweden = 0.21 | ||||||||||
| Urban = 0 | ||||||||||
| Season = 0.6 | ||||||||||
| Year = 2006 | ||||||||||
|
|
Global | 101 (35) | 0.90 | Not reported | Annual (permanent) payments = 1 | x | Rainforest, avoid loss | 491.93 | ||
| Individual (ref: household) = 0 | x | Deciduous & perennial, avoid loss | 85.14 | |||||||
| Dichotomous choice = 1 | x | Coniferous & other, avoid loss | 45.16 | |||||||
| Open ended = 0 | x | Rainforest, gain | 837.43 | |||||||
| Mail survey = 0.42 | x | Deciduous & perennial, gain | 144.95 | |||||||
| Recreation = 0 | x | Coniferous & other, gain | 76.89 | |||||||
| Non–Scandinavian eu countries = 0.297 | ||||||||||
|
|
Global | 101 (35) | 0.90 | Not reported |
GDP/10 000 = 3.4614 (from |
|||||
| Forest area in the country = 83700/100000 | ||||||||||
| Period 1996–2002 = 0 | ||||||||||
|
|
Global (US focus) | 317 (not given) | – | Not reported | Mainly non–use value = 1 | x | Species | 3.39 | ||
| Dichotomous choice = 1 | x | Forest | 3.88 | |||||||
| Gain (ref: avoiding loss) = 0 | x | Water or other (grasslands, mountains, cultural environments) | 8.91 | |||||||
| Quantitatively defined environmental change = 0.48 | ||||||||||
|
GDP = 34 614 (from |
||||||||||
| Year = 2006 | ||||||||||
|
|
Europe | 17 | 0.447 | Not reported | Resident =1 | x | Mountain | 1785 | ||
| Travel cost method = 0 | ||||||||||
| Choice experiment = 0 | ||||||||||
| Share of agriculture in total gross value added (GVA)= 2.15% | ||||||||||
| Share of Less–Favored Areas subsidies = 15% | ||||||||||
|
|
Global (19 countries, none from Africa) | 109 (47) | 0.909 | Out–of–sample median (mean) 21% (48%), within sample 14% (17%) | Resident = 1 | x | Charismatic mammal, avoid loss | 78.68 | ||
| Open ended (ref: dichotomous choice) = 0 | x | Charismatic marine mammal or turtle, avoid loss | 249.73 | |||||||
| Payment card (ref: dichotomous choice) = 0 | x | Non–charismatic mammal, avoid loss | 45.90 | |||||||
|
|
Global (19 countries, none from Africa) | 109 (47) | 0.909 | Out–of–sample median (mean) 21% (48%), within sample 14% (17%) | Annual (>6 years) = 1 | x | Non–charismatic marine mammal or turtle, avoid loss | 145.68 | ||
| Only lump sum studies included | x | Non–threatened charismatic mammal, avoid loss | 28.34 | |||||||
| Sample mean for population gain was 167%, used in the last example | x | Charismatic mammal, population gain of 167% | 47.13 | |||||||
|
|
30 | NA | NA | (No statistical model with covariates, but an apriori algorithm) | x | Woodlands | 11.40 < WTP ≤ 24.38 | |||
| 11 | x | Watercour–ses | 24.38 < WTP ≤ 37.73 | |||||||
|
|
9 | (No statistical model with covariates, but an apriori algorithm) | x | x | Wildlife* | WTP ≤ 11.40 | ||||
| 7 | x | Endangered species | WTP > 46.1 | |||||||
| 6 | x | Wetlands | 37.73 < WTP ≤ 46.1 | |||||||
| 6 | x | Biodiversity | 24.38 < WTP ≤ 37.73 | |||||||
| 5 | x | Landscape | WTP > 46.1 | |||||||
| 4 | x | National parks and nature reserves | WTP ≤ 11.40 | |||||||
Then, correspondingly, we searched for reviews and meta-analyses of previous surrogate studies evaluating the biodiversity surrogacy power of different taxa used as umbrella, keystone and indicator species from EBSCO, ISI Web of Knowledge and Scopus databases as well as Google Scholar (see a list of search strings in Suppl. material
Previous meta-analyses on surrogate literature. The table contains key information related to biodiversity surrogacy power evaluations of potential conservation flagships extracted from the reviewed literature.
| Surrogates (Species/ taxon/ group) | Surrogate type | Targets/ response taxa | Number of reviewed studies (observations) | Spatial scale | Statical tests/ software | R2 | Correlation (or regression) coefficient | Difference to control (SAI/mean species richness/ abundance per species) | Found support for biodiv. surrogacy (Y, L/M N, U) | Reference |
|---|---|---|---|---|---|---|---|---|---|---|
| Birds | Cross–taxon congruence (SR) | Plants, herptiles, mammals, butterflies, beetles, other invertebrates, multi–taxa | 41 (145) | Global, Asia, Australasia, Europe, North America | Full meta– analysis with MetaWin 2.0 | 19% | 0.43 Mean all (REM) 0.399 multiple taxa 0.613 mammals 0.442 beetles 0.44 other invertebr. 0.448 plants 0.481 herptiles –0.143 polypores | – | L/M |
|
| 43 taxa (Invertebrates, plants, vertebrates) | Cross–taxon congruence (SR) | Other taxa | 49 (237) | Global, arctic, temperate, tropical | Meta– analysis of richness correlations | 14% | 0.37 | – | L/M |
|
| 13 taxa (plants, vertebrates, invertebrates, fungi) | Cross–taxon congruence (SR, Com, C) | Unobserved taxa | 64 (742 for SR; 274 for Com) | Global | Calculation of SAI, Linear models | Mean R2 | 0.35 Mean (SR) | 0.36 Mean SAI | N |
|
| 17% (SR), | 0.27 Mean (Com) | |||||||||
| 13% (Com) | 0.29 Birds (SR) 0.32 Reptiles (SR) 0.35 Plants (SR) 0.39 Mammals (SR) 0.41 Amphibians (SR) | |||||||||
| Animals, vascular plants, microorganism, mixed taxa | Cross–taxon congruence (SR, Com) | Other biological /taxonomic groups | 86 (2939) | Ecosystem level (aquatic/ terrestrial) | Fisher’s Z, Mantel’s fM, Procrustes rP, random effect models | 2% (subgroup analysis) | 0.50 (SR) 0.51 (Com rM) 0.41 (Com rP) | – | N |
|
| 20 taxonomic groups of aquatic organisms | Cross–taxon congruence (SR) | Other taxonomic groups | 16 (96) | North America and Europe (aquatic ecosystems) | Categorical meta– analysis, Fisher’s Z, MAc in R | – | 0.37 for body size ratio 1:1, 0.18 for 1:100– 10000 | – | Y |
|
| 12 taxonomic groups (plants, vertebrates, invertebrates) | Cross–taxon congruence (SR, Com) | Other taxonomic groups/ unmeasured taxa | 147 (1189 for SR, 36 for Com) | Global | GAMLSS model with sample size and spatial predictors | Mean: 11% (SR), 5% (Com), Best SR: tracheophyta– lepidoptera 16.3%, Coleoptera– Hymenoptera 13.9%, aves– mammalia13.6%, tracheophyta– bryophyta 13.0%, Best Com: plantae– exopterygota 15.1%, aves–lepidoptera 12.1%, aves– coleoptera 11.5% | – | – | L/M |
|
| Plants | Cross–taxon congruence (SR) | Arthropods, birds, herps, mammals | 103 (320) | Terrestrial ecosystems | Species richness correlations | 20% | 0.45 | – | L/M |
|
| Aquatic organisms | Cross–taxon congruence (SR, Com), Indicator groups | Other taxa | – | Ecosystem level (inland Aquatic systems) | Narrative review | – | – | – | N |
|
| Taxa used in reserve selection (listed in Table |
Cross–taxon congruence (C) | Other taxa (listed in Table |
27 (464) | – | Comparison of surrogate curve to optimal curve and random curve, Calculation of SAI | – | – | SAI (Median): 0.41 Cross–taxon (all) 0.46 Vertebrate surrogate, vertebrate targets 0.26 Vertebrate surrogates, non– vertebrate targets 0.33 Bird surrogates, nonbird target 0.57 Threatened/ listed species surrogates 0.52 Threatened/ listed species targets | L/M |
|
| Higher taxa, cross–taxa, subset taxa | Cross–taxon congruence (SR, Com, C)* | Other taxa/ target community | 20 (264) | Global (marine ecosystems) | Bayesian meta– analysis (hierarchical model) | 43% (SR), | – | – | L/M |
|
| 47% (Com), | ||||||||||
| 38% (C) | ||||||||||
| 42% cross–taxa, | ||||||||||
| 43% subset of taxa, | ||||||||||
| 43% higher taxa, | ||||||||||
| 30% tropical reefs, | ||||||||||
| 50% temperate reefs, | ||||||||||
| 54% soft bottoms | ||||||||||
| Tree species richness | Indicator of species richness | macrofungal species richness | 25 (184) | Global | Mann–Whitney U–test, linear regression, cluster analysis | 29.6% | 6.39 regression coef. (tree species richness and all macrofungi) | – | Y |
|
| 83 forest biodiversity indicators/ Indicator groups (vertebrates, invertebrates, fungi, plants, lichens) | Biodiversity indicators | Indicandum (the indicated aspect of biodiversity) | 142/80 (412) | Europe | Qualitative analysis. | – | – | – | L/M |
|
| Non–lichenized fungi | Biodiversity indicator/ surrogate | Forest habitats | 25 | Europe | – | – | – | – | L/M |
|
| Species, stand, ecosystem, landscape | Indicators of ecological integrity | Integrity of an ecosystem | – | – | – | – | – | – | L/M |
|
| General useful–ness of the umbrella species concept | Umbrella species | Co–occurring species | 18 | – | – | – | – | – | L/M |
|
| Birds, mammals | putative umbrella species | Co–occurring species (taxonomic group, size, taxonomic similarity, resource use, trophic level) | 15 (–) | – | Categorical meta–analysis, comparisons between areas, rank correlation tests, grand mean effect size calculations | – | – | Hedges d: 6 (mean species richness) 4 (abundance per species, mean), | L/M |
|
| 3.1 (abundance pertaxonomic group, mean) | ||||||||||
| Species richness: Birds 8 Omnivorous birds 19 Small mammals (<0.25kg) 1 Abundance per species: Birds 9, Mammals 4, Small mammals (<0.25kg) 3.5 Large mammals (> 500kg) 3.5 Abundance per taxonomic group: Birds 8** | ||||||||||
| Plants, vertebrates, invertebrates, fungi, viruses | umbrella | Freshwater wetlands dependent taxa | 53 (–) | – | Bayesian belief network models | – | – | – | L/M |
|
| Large carnivores | keystones, umbrellas | Other species | – | North America | – | – | – | – | L/M |
|
| Large carnivore guild | ecological keystone, umbrella, indicator | Biodiversity | – | Southern Africa | – | – | – | – | L/M |
|
| Large carnivores | umbrella, keystone, indicator | Other species in Boreal forests | – | Scandinavia | – | – | – | – | L/M |
|
| Top predators | keystone, umbrella, biodiversity indicators | Species richness (biodiversity) | 19 (structuring potential), 8 (biodiversity value) | – | – | – | – | – | L/M |
|
| 40 small mammal species | Keystone/ ecological engineer | Biodiversity, species richness | 63 (106 data entries) | – | Calculation of effect sizes, MetaWin software | – | Signed effect sizes: ns richness, ns diversity, 0.92 biomass | – | L/M |
|
| Frugivorous mammals | Keystones | Tree species | – | Tropical forests | – | – | – | – | L/M |
|
| Scattered trees | Keystone structure | Vertebrates, arthropods, plants | 62 (471) | Global | Calculation of response ratio, Linear mixed–effect models, linear models | – | Average response ratios: 1.6 arthropods 2.3 vertebrates 5.3 woody plants | – | Y |
|
| Neotropical palm species | hyperkeystone species | Vertebrate species | – | Neotropics | Resource type classification, species interaction rankings | – | – | – | Y |
|
| Potential keystone plants | Keystone plant resources | Mammals (frugivores) | – | Neotropical forests sites (Amazonia) | – | – | – | – | L/M |
|
| Terrestrial animal species | Surrogate species | Co–occurring species in terrestrial systems | 53 (–) | – | Unable to run analysis | U |
|
|||
| Marine species | Focal species | Marine biodiversity | – | – | – | – | – | – | L/M |
|
| Beavers | Ecosystem engineer, keystone species | Plants, reptiles, invertebrates, amphibians, birds, mammals | 49 | Regional (Scotland) | Qualitative analysis | – | – | – | Y |
|
| Eurasian beaver, North American beaver | Keystone species, ecosystem engineer | Plants, aquatic invertebrates, terrestrial invertebrates, fish, birds, amphibians, semiaquatic mammals, terrestrial mammals | – | Old and New world | – | – | – | – | L/M |
|
| Eurasian beaver | Keystone species, ecological engineer | Invertebrates, amphibians and reptiles, birds, mammals | – | – | – | – | – | – | L/M |
|
| Salamanders | Keystone species (ecological functions) | Other species | – | Terrestrial and aquatic environments in North America | Qualitative analysis | – | – | – | Y | Davic and Welsh, (2004) |
| Cushion plants (as nurse plants) | Keystone species | Other vascular plants (native and exotic) | 9 (617) | high–Andes (in South America) | Averaging of odds ratios, calculation of confidence intervals, heterogeneity tests (Q–test), fixed–effect categorized model | – | ln (odds ratio) exotic species 1.26 native species 0.63 perennial spp 0.87 annual spp –1.2 low stress comm. 0.17 high stress comm. 0.7 | L/M |
|
|
| Prairie dogs | Keystone species | Prairie vertebrates | “over 200 references” | Prairie ecosystem | Qualitative analysis | – | – | – | Y |
|
Overview methods
Due to a relatively small number of highly heterogeneous reviews, we did not attempt to apply statistical meta-analyses to the samples of meta-analyses. Instead, we summarized the findings of previous meta-analyses, systematic reviews and essays in Tables
Meta-analytic benefit transfer means using the meta-regression model to predict a welfare estimate in a new context (interpolation or even extrapolation) and is increasingly used in environmental economics to inform policy making in circumstances that have not been directly studied (
To make a BT prediction, one must decide what variable values to input to the model. To make our predictions for WTP for flagship types as comparable as possible with each other, we set as many variables as possible to be equal across the studies, and used sample means for variables unique to specific studies, when available. For example, for all studies where elicitation technique was significant, we used Dichotomous choice, and for three studies that had Gross domestic product (GDP) as a covariate, we used the same value (see Table
In relation to studies on biodiversity surrogacy power, each paper was screened for the variables listed in Table
Results
Characteristics of WTP meta-analyses and their benefit transfer capability
We summarize the results from the 12 meta-analyses that fulfilled our criteria for overview in Table
The samples have been relatively small and not at all representative of different kinds of species. WTP studies on species have been strongly biased toward mammals, somewhat toward birds, while showing only marginal interest toward other taxa, e.g., reptiles and invertebrates (Table
There was great variation in the explanatory power reported for the meta-analysis models, R2 values ranging from 8% (
Typical to WTP meta-analyses, there were from one to several significant methodological variables in each model (Table
Estimates of fundraising potential of different flagship types
We calculated benefit transfer estimates for the WTP values for the different flagship example cases, which are given in Table
Because we were not able to fully standardize the variables for BT, we focus mostly on within-study comparisons of flagship types. Few consistent patterns emerge from the predicted values. Aquatic ecosystems appear to have higher WTP than forests in all meta-analyses where they were compared against each other (
The results regarding species versus holistic concepts as flagships were few and mixed: In one study mammals attracted 3–5 times higher payments than marine or terrestrial habitats (
Influence of affective vs. scientific good characteristics on WTP
The affective aspect that was assessed most often in the meta-analyses was species’ charisma. Its impact on WTP appeared positive in three of the MAs (
Scope sensitivity in WTP meta-analyses
Scope sensitivity, which refers to the amount of the good being valued (in this case, “how much” is being conserved in terms of e.g., area or population size) may affect the WTP results. Quantifying achievements in conservation is, however, not straightforward. In some of the meta-analyses we reviewed, the area was found to be non-significant (
In some studies, WTP appeared to be larger for avoiding losses of existing values than it was for achieving gains (
Description of the variables that were reviewed in the surrogate meta-analyses, essays and systematic reviews that were included in our overview of reviews.
| Item/variable | Description of the item/variable |
|---|---|
| Surrogate species/taxa | The taxon/taxa used as a biodiversity surrogate (or as biodiversity surrogates) |
| Surrogacy type | Which surrogate species approach was applied in the study (e.g., Cross-taxon congruence*, indicator of species richness, biodiversity indicator, umbrella species, keystone species, ecological engineer, focal species etc). |
| Target or response taxa | Co-occurring taxa (or a taxon): a taxon/taxa whose existence is affected or associated with a biodiversity surrogate |
| Number of reviewed studies | The number of studies included in the original review/meta-analysis |
| Spatial scale | Spatial range covered in the study** |
| Statistical tests/software | Statistical tests applied in the study |
| R2 | Indicates the share of the variation the model explained |
| Correlation or regression coefficient (effect sizes) | Results of analysis that explored relationships (e.g., relationships between surrogate taxa and richness of co-occurring taxa) |
| Difference to control measure | Calculation of (richness) indices: SAI (Species accumulation index), mean species richness, abundance per species. This was reported by taxa when applicable. |
| Evaluation of ecological surrogacy power | An estimate of the biodiversity surrogate power of the surrogate taxon including the options yes, no, limited/mixed |
The different types of flagships themselves also represent increasing scope in one dimension, from a single species to multiple, and further to ecosystems or to biodiversity in its entirety. We found no evidence of coherent preference of holistic concepts over single species across meta-analyses, or vice versa. The issue of single vs. many species has been approached in diverse primary studies in different ways, with highly mixed results, but it has not been the specific subject of any meta-analysis, even though
Biodiversity surrogacy potential
Altogether, we identified 34 papers including fourteen meta-analyses, five systematic reviews and fifteen essays for the overview of reviews on biodiversity surrogate types (See Suppl. material
According to our overview of reviews, trees can be promising keystone species by providing a variety of resources to other species (
Discussion
Based on the key results from previous sections, we want to highlight a few observations. Firstly, we did not find consistent evidence for superior fundraising ability of charismatic flagships as compared to other potential flagship types. Secondly, evidence for surrogate power was equally mixed, with most positive results being for e.g., trees as keystones or plants and birds as surrogates for other taxa, and rarely for individual charismatic animal species typically used as flagships. Therefore, it was not possible to give all-inclusive recommendations on which kind of flagships should be used as conservation tools. We next discuss potential reasons behind these findings and ways forward.
Potential reasons for mixed findings related to fundraising ability
Based on our overview, no conclusions could be drawn for universal effectiveness of either species or holistic flagships in fundraising. A possible reason for this is varying and context dependent preferences of potential donors. Also, past research on donor preferences suggests that potential donors should indeed not be treated as a single group due to their varying values and motivations to donate (
While some potential donors still prefer the classical charismatic figurehead species, for others different determinants of WTP may be more important (
Apart from aesthetic or other affective characteristics of species, a further motivation for preferring species over holistic concepts could be so called ‘impact philanthropy’ (
Scope sensitivity has been suggested to affect WTP but has been criticized as a poor measure for complex environmental goods (
It should be noted that it was not possible to fully standardize the BT predictions due to the inconsistent covariates and heterogeneity of original studies. Especially the varying geographical extents of the studies caused problems with the benefit transfer. Even though the WTP values from different countries are purchasing power parity (PPP) corrected in the meta-analyses, benefit transfer to an entirely common setup across meta-analyses is not possible as the studies may or may not have e.g., region, developing country status or household income as covariates. PPP does not explain behavioral variation due to economic and cultural differences (see
The large variability both in the R2 values (i.e., the goodness of fit of the meta-regression model) and the varying number of significant covariates in the meta-regression models (cf. Table
Another equivocal factor that influenced the BT predictions was the mixed impact of study year on WTP in some of the meta-regression models, in most cases with more recent studies producing lower estimates, which has been attributed in the past to methodological developments in WTP studies (
The choice of biodiversity surrogates and recent developments
The idea of using simplistic taxon surrogates for conservation planning is attractive because data available for making decisions is scarce. However, typically, the theoretical basis behind the expectation of finding surrogate relationships has been poorly, if at all, identified (
The limited support for cross-taxon congruence in species richness, composition and/or complementarity in our overview of reviews on surrogacy meta-analyses suggest that the usefulness of one taxon as a substitute for others may be limited (Table
Another promising avenue is to take advantage of conservation planning methods directly in identifying surrogates, rather than post hoc for applying them to practice.
Challenges with present work and suggestions for future research
A taxonomic bias toward mammals and birds was evident in WTP research, but it aligns relatively well with what has typically been used for fundraising (
WTP studies covered by the reviews we overviewed are highly heterogeneous, and we do not know how well they reflect actual donations to ENGOs. Some of the primary literature on WTP comes from the context of ecosystem service valuation and framing the questions as ecosystem service instead of donating to ENGOs could influence WTP in unknown ways. WTP studies are often conducted with the purpose of quantifying public support to inform choices of resource allocation for various policies. In this context monetary valuation has been seen as inappropriate to guide choices that are essentially moral or ethical (
Similarly, methods used to assess biodiversity surrogacy power varied between meta-analyses, making comparisons between studies difficult. Even though much attention has lately been given to standardizing conservation research (
Another issue to consider in future studies is the impact of human-wildlife conflicts especially on rural economically weaker households and businesses, leading to regional differences in attitudes toward different flagships (
Research is lacking on WTP to pure marketing flagships as opposed to conservation of the flagship itself: Does a charismatic figurehead increase WTP toward any conservation project, or do people prefer charismatic flagships only when the species itself is supported? An additional factor that would need to be considered to achieve a more comprehensive picture of the cost-effectiveness of various flagships as surrogates, is the variation in expenses of collecting different types of data (
Future WTP-studies would do well to also include measures of pro-environmental attitudes and values, such as biospheric values, as covariates (
Recommendations for fundraising
A key message to ENGOs based on our results is the need to diversify strategies in fundraising, as there is no evidence in favor of a particular strategy, but ideally fundraising considers different donor preferences and values. Fundraising campaigns may have limited possibilities for informing the potential donors at the time of fundraising but channeling some funds to increasing awareness of the plight of many uncharismatic species or about holistic targets could return via increased donations adding to the many benefits of raising awareness. Nonetheless, charisma could still be useful in marketing contexts where an image must make an instant impact, such as bus shelter advertising, but should be in a much smaller role when potential donors have the possibility to make informed choices between flagships based on prior or provided knowledge.
We found varying sensitivity to scope in the WTP meta-analyses. ENGOs could probably attract more funds if they were able to convince the donors that their projects have a broader scope and higher effectiveness. Quantifying conservation effectiveness is certainly not straightforward in research, nor in a donation situation where it may be quite ambiguous what will be done with the money. Nonetheless, it seems plausible that ENGOs could benefit from informing the donors about what can be achieved with the donations, especially among donor segments representing ‘effective altruism’. Yet there may be other segments for which standard economic theory could simply describe poorly the behaviors related to philanthropy, such as, ‘impact philanthropists’, who may prefer prominent, individual species, specific, delimited locations, or even adoption programs for animal individuals, where it is possible to observe the impact their donations are making.
It appeared that WTP was lower for restoration than for preservation purposes. Fundraising campaigns for restoration need to put effort into convincing potential donors of its effectiveness and necessity and explaining how it is a fundamental part in preventing extinctions and further losses. WTP appeared lower also for some less prominent terrestrial ecosystems as opposed to e.g., tropical, and marine ecosystems. Such targets that suffer from lower WTP, could perhaps benefit most from well-planned, strategic use of charismatic flagship species. Research is still needed to improve our understanding on how to reach different donor segments, but targeted marketing in social media has great potential for this purpose.
Conclusions
Past research has not succeeded very well in disentangling the complexities of surrogate relationships or WTP for conservation flagships. The heterogeneity of research methods used as well as biased sampling in the previous literature does not make it any easier, and therefore it would be necessary to harmonize the setups in future studies. The apparent contradictions in various findings regarding WTP are probably at least partly explained by heterogeneity in human preferences and values, and therefore the donors should not be treated as a single group. Furthermore, we were unable to identify species that would be effective both as surrogates and fundraising tools. Given the lack of information and overall low expectations for the biodiversity surrogacy power of charismatic species, it would be more effective to use these species primarily for marketing purposes, as also suggested by
Acknowledgements
We thank the Kone foundation for supporting both authors. We also thank reviewers Soumyajit Koley and Kristina Zhukova and one anonymous reviewer for their valuable comments and suggestions. We are also grateful to Maarit Jokinen and Georgia Garrard for their insightful comments and suggestions on our manuscript. We also thank Thomas Lilley for checking the language of our manuscript.
References
- Albert C, Luque GM, Courchamp F (2018) The twenty most charismatic species. PLoS ONE 13(7): 1–12. https://doi.org/10.1371/journal.pone.0199149
- Amos C, Holmes GR, Allred A (2015) Exploring Impact Philanthropy, Altruistic, Hedonic, and Egoistic Motivations to Support Animal Causes. Journal of Nonprofit & Public Sector Marketing 27(4): 351–372. https://doi.org/10.1080/10495142.2015.1015377
- Amuakwa-Mensah F, Bärenbold R, Riemer O (2018) Deriving a Benefit Transfer Function for Threatened and Endangered Species in Interaction with Their Level of Charisma. Environments 5(2): 1–18. https://doi.org/10.3390/environments5020031
- Andelman SJ, Fagan WF (2000) Umbrellas and flagships: Efficient conservation surrogates or expensive mistakes? Proceedings of the National Academy of Sciences of the United States of America 97(11): 5954–5959. https://doi.org/10.1073/pnas.100126797
- Arredondo-Núñez A, Badano EI, Bustamante RO (2009) How beneficial are nurse plants? A meta-analysis of the effects of cushion plants on high-Andean plant communities. Community Ecology 10(1): 1–6. https://doi.org/10.1556/ComEc.10.2009.1.1
- Assessment ME (2005) Ecosystems and Human Well-being: Synthesis. Islands Press, Washington DC, 141 pp. https://www.millenniumassessment.org/documents/document.356.aspx.pdf
- Barrio M, Loureiro ML (2010) A meta-analysis of contingent valuation forest studies. Ecological Economics 69(5): 1023–1030. https://doi.org/10.1016/j.ecolecon.2009.11.016
- Bergstrom JC, Taylor LO (2006) Using meta-analysis for benefits transfer: Theory and practice. Ecological Economics 60(2): 351–360. https://doi.org/10.1016/j.ecolecon.2006.06.015
- Börger T (2012) Social Desirability and Environmental Valuation. Peter Lang GmbH, Frankfurt am Main, 271 pp. https://doi.org/10.3726/978-3-653-01583-6
- Börner J, Schulz D, Wunder S, Pfaff A (2020) The effectiveness of forest conservation policies and programs. Annual Review of Resource Economics 12(1): 45–64. https://doi.org/10.1146/annurev-resource-110119-025703
- Branton M, Richardson JS (2011) Assessing the Value of the Umbrella-Species Concept for Conservation Planning with Meta-Analysis. Conservation Biology 25(1): 9–20. https://doi.org/10.1111/j.1523-1739.2010.01606.x
- Carignan V, Villard M (2002) Selecting indicator species to monitor ecological integrity: A review. Economical Monitoring and Assessment 27(24): 3189–3194.
- Caro T (2010a) Flagship species. In: Caro T, Girling S (Eds) Conservation by Proxy: Indicator, Umbrella, Keystone, Flagship, and Other Surrogate Species. Island Press, Washington DC, USA, 245–262.
- Caro T (2010b) Surrogate Species in the Real World. In: Caro T, Girling S (Eds) Conservation by Proxy: Indicator, Umbrella, Keystone, Flagship, and Other Surrogate Species. Island Press, Washington DC, USA, 263–284.
- Caro T (2010c) Umbrella species and landscape species. In: Caro T, Girling S (Eds) Conservation by Proxy: Indicator, Umbrella, Keystone, Flagship, and Other Surrogate Species. Island Press, Washington DC, USA, 99–126.
- Caro T (2010d) Keystone, Engineering, and Foundation Species. In: Caro T, Girling S (Eds) Conservation by Proxy: Indicator, Umbrella, Keystone, Flagship, and Other Surrogate Species. Island Press, Washington DC, USA, 127–157.
- Castagneyrol B, Jactel H (2012) Unraveling plant – animal diversity relationships: A meta-regression analysis. Ecology 93(9): 2115–2124. https://doi.org/10.1890/11-1300.1
- Charities aid foundation (2018) CAF World Giving Index. A Global view of giving trends. https://sinapse.gife.org.br/download/caf-world-giving-index-2018-a-global-view-of-giving-trends
- Christie AP, Amano T, Martin PA, Petrovan SO, Shackelford GE, Simmons BI, Smith RK, Williams DR, Wordley CFR, Sutherland WJ (2020) The challenge of biased evidence in conservation. Conservation Biology 35(1): 249–262. https://doi.org/10.1111/cobi.13577
- Clucas B, McHugh K, Caro T (2008) Flagship species on covers of US conservation and nature magazines. Biodiversity and Conservation 17(6): 1517–1528. https://doi.org/10.1007/s10531-008-9361-0
- Costa S, Cary M, Helling DK, Pereira J, Mateus C (2019) An overview of systematic reviews of economic evaluations of pharmacy-based public health interventions: Addressing methodological challenges. Systematic Reviews 8(1): 272. https://doi.org/10.1186/s13643-019-1177-3
- Dalerum F, Somers M, Kunkel KE, Cameron EZ (2008) The potential for large carnivores to act as biodiversity surrogates in southern Africa. Biodiversity and Conservation 17(12): 2939–2949. https://doi.org/10.1007/s10531-008-9406-4
- Davic RD, Welsh Jr HH (2004) On the ecological roles of salamanders. Annual Review of Ecology, Evolution, and Systematics 35(1): 405–434. https://doi.org/10.1146/annurev.ecolsys.35.112202.130116
- de Groot JIM, Thørgesen J (2012) Values and pro-environmental behaviour. In: Steg L, Van den Berg AE, de Groot JIM (Eds) Environmental Psychology: An Introduction. BPS Blackwell, 141–152.
- de Morais GF, dos Santos Ribas LG, Ortega JCG, Heino J, Bini LM (2018) Biological surrogates: A word of caution. Ecological Indicators 88: 214–218. https://doi.org/10.1016/j.ecolind.2018.01.027
- Di Minin E, Moilanen A (2014) Improving the surrogacy effectiveness of charismatic megafauna with well-surveyed taxonomic groups and habitat types. Journal of Applied Ecology 51(2): 281–288. https://doi.org/10.1111/1365-2664.12203
- Di Minin E, Slotow R, Hunter LTB, Montesino Pouzols F, Toivonen T, Verburg PH, Leader-Williams N, Petracca L, Moilanen A (2016) Global priorities for national carnivore conservation under land use change. Scientific Reports 6(1): 1–9. https://doi.org/10.1038/srep23814
- Douglas LR, Veríssimo D (2013) Flagships or Battleships: Deconstructing the Relationship between Social Conflict and Conservation Flagship Species. Environment and Society: Advances in Research 4(1): 98–116. https://doi.org/10.3167/ares.2013.040107
- Ducarme F, Luque GM, Courchamp F (2013) What are “charismatic species” for conservation biologists? BioSciences Master Reviews: 1–8.
- Duncan B (2004) A theory of impact philanthropy. Journal of Public Economics 88(9–10): 2159–2180. https://doi.org/10.1016/S0047-2727(03)00037-9
- Eglington SM, Noble DG, Fuller RJ (2012) A meta-analysis of spatial relationships in species richness across taxa: Birds as indicators of wider biodiversity in temperate regions. Journal for Nature Conservation 20(5): 301–309. https://doi.org/10.1016/j.jnc.2012.07.002
- Escalante T, Varela-Anaya AM, Noguera-Urbano EA, Elguea-Manrique LM, Ochoa-Ochoa LM, Gutiérrez-Velázquez AL, Reyes-Castillo P, Hernández HM, Gómez-Hinostrosa C, Navarro-Sigüenza AG, Téllez-Valdés O, Rodríguez-Soto C (2020) Evaluation of five taxa as surrogates for conservation prioritization in the Transmexican Volcanic Belt, Mexico. Journal for Nature Conservation 54: e125800. https://doi.org/10.1016/j.jnc.2020.125800
- Estifanos T, Polyakov M, Pandit R, Hailu A, Burton M (2018) Protection of the Ethiopian Wolf: What are tourists willing to pay for? UWA Agricultural and Resource Economics Protection of the Ethiopian Wolf: What are tourists willing to pay for? Working Paper, School of Agricultural and Resource Economics, University of Western Australia, 43 pp.
- Favreau JM, Drew CA, Hess GR, Rubino MJ, Koch FH, Eschelbach KA (2006) Recommendations for assessing the effectiveness of surrogate species approaches. Biodiversity and Conservation 15(12): 3949–3969. https://doi.org/10.1007/s10531-005-2631-1
- Fernando P, Wikramanayake E, Weerakoon D, Jayasinghe LKA, Gunawardene M, Janaka HK (2005) Perceptions and patterns of human-elephant conflict in old and new settlements in Sri Lanka: Insights for mitigation and management. Biodiversity and Conservation 14(10): 2465–2481. https://doi.org/10.1007/s10531-004-0216-z
- Freeling BS, Connell SD (2020) Funding Conservation through an Emerging Social Movement. Trends in Ecology & Evolution 35(1): 3–6. https://doi.org/10.1016/j.tree.2019.09.002
- Gao T, Nielsen AB, Hedblom M (2015) Reviewing the strength of evidence of biodiversity indicators for forest ecosystems in Europe. Ecological Indicators 57: 420–434. https://doi.org/10.1016/j.ecolind.2015.05.028
- Garshelis DL, Noyce KV, St-Louis V (2020) Population reduction by hunting helps control human-wildlife conflicts for a species that is a conservation success story. PLoS ONE 15(8): 1–20. https://doi.org/10.1371/journal.pone.0237274
- Grooten M, Almond REA (2018) Living planet report 2018. https://www.worldwildlife.org/pages/living-planet-report-2018
- Halme P, Holec J, Heilmann-Clausen J (2017) The history and future of fungi as biodiversity surrogates in forests. Fungal Ecology 27: 193–201. https://doi.org/10.1016/j.funeco.2016.10.005
- Hanley ND, Schläpfer F, Spurgeon J (2003) Aggregating the benefits of environmental improvements: Distance-decay functions for use and non-use values. Journal of Environmental Management 68(3): 297–304. https://doi.org/10.1016/S0301-4797(03)00084-7
- Heberlein TA, Wilson MA, Bishop RC, Schaeffer NC (2005) Rethinking the scope test as a criterion for validity in contingent valuation. Journal of Environmental Economics and Management 50(1): 1–22. https://doi.org/10.1016/j.jeem.2004.09.005
- Heino J (2010) Are indicator groups and cross-taxon congruence useful for predicting biodiversity in aquatic ecosystems? Ecological Indicators 10(2): 112–117. https://doi.org/10.1016/j.ecolind.2009.04.013
- Hjerpe E, Hussain A, Phillips S (2015) Valuing type and scope of ecosystem conservation: A meta-analysis. Journal of Forest Economics 21(1): 32–50. https://doi.org/10.1016/j.jfe.2014.12.001
- Home R, Keller C, Nagel P, Bauer N, Hunziker M (2009) Selection criteria for flagship species by conservation organizations. Environmental Conservation 36(2): 139–148. https://doi.org/10.1017/S0376892909990051
- Hunt H, Pollock A, Campbell P, Estcourt L, Brunton G (2018) An introduction to overviews of reviews: Planning a relevant research question and objective for an overview. Systematic Reviews 7(1): 1–9. https://doi.org/10.1186/s13643-018-0695-8
- Jacobsen JB, Hanley N (2009) Are There Income Effects on Global Willingness to Pay for Biodiversity Conservation? Environmental and Resource Economics 43(2): 137–160. https://doi.org/10.1007/s10640-008-9226-8
- Jacobsen JB, Lundhede TH, Thorsen BJ (2012) Valuation of wildlife populations above survival. Biodiversity and Conservation 21(2): 543–563. https://doi.org/10.1007/s10531-011-0200-3
- Janiszewski P, Hanzal V, Misiukiewicz AW (2014) The Eurasian beaver (Castor fiber) as a keystone species - A literature review. Baltic Forestry 20: 277–286.
- Kanagavel A, Raghavan R, Veríssimo D (2014) Beyond the “General Public”: Implications of Audience Characteristics for Promoting Species Conservation in the Western Ghats Hotspot, India. Ambio 43(2): 138–148. https://doi.org/10.1007/s13280-013-0434-2
- Kaul S, Boyle KJ, Kuminoff NV, Parmeter CF, Pope JC (2013) What can we learn from benefit transfer errors? Evidence from 20 years of research on convergent validity. Journal of Environmental Economics and Management 66(1): 90–104. https://doi.org/10.1016/j.jeem.2013.03.001
- Kotliar NB, Baker BW, Whicker AD, Plumb G (1999) A critical review of assumptions about the prairie dog as a keystone species. Environmental Management 24(2): 177–192. https://doi.org/10.1007/s002679900225
- Lindhjem H (2006) 20 Years of Stated Preference Valuation of Non-Timber. Journal of Forest Economics 4: 251–277. https://doi.org/10.1016/j.jfe.2006.09.003
- Lindhjem H, Tuan TH (2012) Valuation of species and nature conservation in Asia and Oceania: A meta-analysis. Environmental Economics and Policy Studies 14(1): 1–22. https://doi.org/10.1007/s10018-011-0019-x
- Lindhjem H, Tuan TH (2015) Benefit transfer of nature conservation values in Asia and Oceania based on meta-analysis: Data heterogeneity and reliability issues. In: Managi S (Ed.) The Routledge Handbook of Environmental Economics in Asia. Routledge, New York, 349–368.
- Linnell JDC, Swenson JONE, Andersen R (2000) Conservation of biodiversity in Scandinavian boreal forests: Large carnivores as flagships, umbrellas, indicators, or keystones? Biodiversity and Conservation 9(7): 857–868. https://doi.org/10.1023/A:1008969104618
- List JA, Gallet CA (2001) What Experimental Protocol Influence Disparities Between Actual and Hypothetical Stated Values? Environmental and Resource Economics 20(3): 241–254. https://doi.org/10.1023/A:1012791822804
- Lundberg P, Vainio A, MacMillan DC, Smith RJ, Veríssimo D, Arponen A (2019) The effect of knowledge, species aesthetic appeal, familiarity and conservation need on willingness to donate. Animal Conservation 22: 432–443. https://doi.org/10.1111/acv.12477
- Lundberg P, Veríssimo D, Vainio A, Arponen A (2020) Preferences for different flagship types in fundraising for nature conservation. Biological Conservation 250: 1–11. https://doi.org/10.1016/j.biocon.2020.108738
- Macdonald EA, Hinks A, Weiss DJ, Dickman A, Burnham D, Sandom CJ, Malhi Y, Macdonald DW (2017) Identifying ambassador species for conservation marketing. Global Ecology and Conservation 12: 204–214. https://doi.org/10.1016/j.gecco.2017.11.006
- MacPherson MP, Webb EB, Raedeke A, Mengel D, Nelson F (2018) A review of Bayesian belief network models as decision-support tools for wetland conservation: Are water birds potential umbrella taxa. Biological Conservation 226: 215–223. https://doi.org/10.1016/j.biocon.2018.08.001
- Maheshwari A, Midha N, Cherukupalli A (2014) Participatory Rural Appraisal and Compensation Intervention: Challenges and Protocols While Managing Large Carnivore-Human Conflict. Human Dimensions of Wildlife 19(1): 62–71. https://doi.org/10.1080/10871209.2013.828247
- Mandelik Y, Roll U, Fleischer A (2010) Cost-efficiency of biodiversity indicators for Mediterranean ecosystems and the effects of socio-economic factors. Journal of Applied Ecology 47(6): 1179–1188. https://doi.org/10.1111/j.1365-2664.2010.01864.x
- Markowitz EM, Slovic P, Västfjäll D, Hodges SD (2013) Compassion fade and the challenge of environmental conservation. Judgment and Decision Making 8: 397–406.
- Martín-López B, Montes C, Benayas J (2008) Economic Valuation of Biodiversity Conservation: The Meaning of Numbers. Conservation Biology 22(3): 624–635. https://doi.org/10.1111/j.1523-1739.2008.00921.x
- McGowan J, Beaumont LJ, Smith RJ, Chauvenet ALM, Harcourt R, Atkinson SC, Mittermeier JC, Esperon-Rodriguez M, Baumgartner JB, Beattie A, Dudaniec RY, Grenyer R, Nipperess DA, Stow A, Possingham HP (2020) Conservation prioritization can resolve the flagship species conundrum. Nature Communications 11(1): 1–7. https://doi.org/10.1038/s41467-020-14554-z
- Mekonnen A, Fashing PJ, Chapman CA, Venkataraman VV, Stenseth NC (2022) The value of flagship and umbrella species for restoration and sustainable development: Bale monkeys and bamboo forest in Ethiopia. Journal for Nature Conservation 65: e126117. https://doi.org/10.1016/j.jnc.2021.126117
- Mellin C, Delean S, Caley J, Edgar G, Meekan M, Pitcher R, Przeslawski R, Williams A, Bradshaw C (2011) Effectiveness of biological surrogates for predicting patterns of marine biodiversity: A global meta-analysis. PLoS ONE 6(6): e20141. https://doi.org/10.1371/journal.pone.0020141
- Meurant M, Gonzalez A, Doxa A, Albert CH (2018) Selecting surrogate species for connectivity conservation. Biological Conservation 227: 326–334. https://doi.org/10.1016/j.biocon.2018.09.028
- Mouquet N, Gravel D, Massol F, Calcagno V (2013) Extending the concept of keystone species to communities and ecosystems. Ecology Letters 16(1): 1–8. https://doi.org/10.1111/ele.12014
- Navrud S, Ready R (2007) Lessons Learned for Environmental Value Transfer. In: Navrud S, Ready R (Eds) Environmental Value Transfer: Issues and Methods. Springer, Dordrecht, The Netherlands, 283–290. https://doi.org/10.1007/1-4020-5405-X_15
- Nelson JP, Kennedy PE (2009) The Use (and Abuse) of Meta-Analysis in Environmental and Natural Resource Economics: An Assessment. Environmental and Resource Economics 42(3): 345–377. https://doi.org/10.1007/s10640-008-9253-5
- Niemelä J, Young J, Alard D, Askasibar M, Henle K, Johnson R, Kurttila M, Larsson TB, Matouch S, Nowicki P, Paiva R, Portoghesi L, Smulders R, Stevenson A, Tartes U, Watt A (2005) Identifying, managing and monitoring conflicts between forest biodiversity conservation and other human interests in Europe. Forest Policy and Economics 7(6): 877–890. https://doi.org/10.1016/j.forpol.2004.04.005
- Nijkamp P, Vindigni G, Nunes PALD (2008) Economic valuation of biodiversity: A comparative study. Ecological Economics 67(2): 217–231. https://doi.org/10.1016/j.ecolecon.2008.03.003
- Noss RF, Quigley HB, Hornocker MG, Merrill T, Paquette PC (1996) Conservation Biology and Carnivore Conservation in the Rocky Mountains. Conservation Biology 10(4): 949–963. https://doi.org/10.1046/j.1523-1739.1996.10040949.x
- Ojea E, Loureiro ML (2011) Identifying the scope effect on a meta-analysis of biodiversity valuation studies. Resource and Energy Economics 33(3): 706–724. https://doi.org/10.1016/j.reseneeco.2011.03.002
- Peres CA (2000) Identifying keystone plant resources in tropical forests: The case of gums from Parkia pods. Journal of Tropical Ecology 16(2): 287–317. https://doi.org/10.1017/S0266467400001413
- Post G, Pandav B (2013) Comparative evaluation of tiger reserves in India. Biodiversity and Conservation 22(12): 2785–2794. https://doi.org/10.1007/s10531-013-0554-9
- Prevedello JA, Almeida-Gomes M, Lindenmayer DB (2018) The importance of scattered trees for biodiversity conservation: A global meta-analysis. Journal of Applied Ecology 55(1): 205–214. https://doi.org/10.1111/1365-2664.12943
- Ready R, Navrud S (2006) International benefit transfer: Methods and validity tests. Ecological Economics 60(2): 429–434. https://doi.org/10.1016/j.ecolecon.2006.05.008
- Richardson L, Loomis J (2009) The total economic value of threatened, endangered and rare species: An updated meta-analysis. Ecological Economics 68(5): 1535–1548. https://doi.org/10.1016/j.ecolecon.2008.10.016
- Roberge J, Angelstam PER (2004) Usefulness of the Umbrella Species Concept as a Conservation Tool. Conservation Biology 18(1): 76–85. https://doi.org/10.1111/j.1523-1739.2004.00450.x
- Rodrigues ASL, Brooks TM (2007) Shortcuts for Biodiversity Conservation Planning: The Effectiveness of Surrogates. Annual Review of Ecology, Evolution, and Systematics 38(1): 713–737. https://doi.org/10.1146/annurev.ecolsys.38.091206.095737
- Rolfe J, Johnston RJ, Rosenberger RS, Brouwer R (2015) Introduction: Benefit Transfer of Environmental and Resource Values. In: Johnston RJ, Rolfe J, Rosenberger RS, Brouwer R (Eds) Benefit Transfer of Environmental and Resource Values: A Guide for Researchers and Practitioners. Springer, 3–17. https://doi.org/10.1007/978-94-017-9930-0_1
- Root-Bernstein M, Ebensperger LA (2013) Meta-analysis of the effects of small mammal disturbances on species diversity, richness and plant biomass. Austral Ecology 38(3): 289–299. https://doi.org/10.1111/j.1442-9993.2012.02403.x
- Rosell F, Bozsér O, Collen P, Parker H (2005) Ecological impact of beavers Castor fiber and Castor canadensis and their ability to modify ecosystems. Mammal Review 35(3–4): 248–276. https://doi.org/10.1111/j.1365-2907.2005.00067.x
- Sætersdal M, Gjerde I (2011) Prioritising conservation areas using species surrogate measures: Consistent with ecological theory? Journal of Applied Ecology 48(5): 1236–1240. https://doi.org/10.1111/j.1365-2664.2011.02027.x
- Schmit JP, Mueller GM, Leacock PR, Mata JL, Wu Q, Huang Y (2005) Assessment of tree species richness as a surrogate for macrofungal species richness. Biological Conservation 121: 99–110. https://doi.org/10.1016/j.biocon.2004.04.013
- Sergio F, Caro T, Brown D, Clucas B, Hunter J, Ketchum J, McHugh K, Hiraldo F (2008) Top Predators as Conservation Tools: Ecological Rationale, Assumptions, and Efficacy. Annual Review of Ecology, Evolution, and Systematics 39(1): 1–19. https://doi.org/10.1146/annurev.ecolsys.39.110707.173545
- Shi X, Gong C, Zhang L, Hu J, Ouyang Z, Xiao Y (2019) Which species should we focus on? Umbrella species assessment in southwest China. Biology (Basel) 8(2): 1–19. https://doi.org/10.3390/biology8020042
- Sibanda L, Van Der Meer E, Hughes C, Macdonald EA, Hunt JE, Parry RH, Dlodlo B, Macdonald DW, Loveridge AJ (2020) Exploring Perceptions of Subsistence Farmers in Northwestern Zimbabwe towards the African Lion (Panthera leo) in the Context of Local Conservation Actions. African Journal of Wildlife Research 50(1): 102–118. https://doi.org/10.3957/056.050.0102
- Sitas N, Baillie JEM, Isaac NJB (2009) What are we saving? Developing a standardized approach for conservation action. Animal Conservation 12(3): 231–237. https://doi.org/10.1111/j.1469-1795.2009.00244.x
- Smith RJ, Veríssimo D, Isaac NJB, Jones KE (2012) Identifying Cinderella species: Uncovering mammals with conservation flagship appeal. Conservation Letters 5(3): 205–212. https://doi.org/10.1111/j.1755-263X.2012.00229.x
- Spash CL (1997) Ethics and Environmental Attitudes with Implications for Economic Valuation. Journal of Environmental Management 50(4): 403–416. https://doi.org/10.1006/jema.1997.0017
- Stoner KE, Riba-Hernández P, Vulinec K, Lambert JE (2007) The role of mammals in creating and modifying seedshadows in tropical forests and some possible consequences of their elimination. Biotropica 39(3): 316–327. https://doi.org/10.1111/j.1744-7429.2007.00292.x
- Stringer AP, Gaywood MJ (2016) The impacts of beavers Castor spp. on biodiversity and the ecological basis for their reintroduction to Scotland, UK. Mammal Review 46(4): 270–283. https://doi.org/10.1111/mam.12068
- Subroy V, Gunawardena A, Polyakov M, Pandit R, Pannell DJ (2019) The worth of wildlife: A meta-analysis of global non-market values of threatened species. Ecological Economics 164: 1–9. https://doi.org/10.1016/j.ecolecon.2019.106374
- Sutherland WJ, Pullin AS, Dolman PM, Knight TM (2004) The need for evidence-based conservation. Trends in Ecology & Evolution 6(6): 305–308. https://doi.org/10.1016/j.tree.2004.03.018
- Tuan TH, Lindhjem H (2008) Meta-Analysis of Nature Conservation Values in Asia & Oceania: Data Heterogeneity and Benefit Transfer Issues. Munich Personal RePEc Archive 11470, 49 pp. https://doi.org/10.2139/ssrn.1295505
- van der Hoek Y, Solas SÁ, Peñuela MC (2019) The palm Mauritia flexuosa, a keystone plant resource on multiple fronts. Biodiversity and Conservation 28(3): 539–551. https://doi.org/10.1007/s10531-018-01686-4
- Van Tonder C, Saayman M, Krugell W (2013) Tourists’ characteristics and willingness to pay to see the Big Five. Journal of Economic and Financial Sciences 6(3): 631–644. https://doi.org/10.4102/jef.v6i3.251
- Velghe K, Gregory-Eaves I (2013) Body Size Is a Significant Predictor of Congruency in Species Richness Patterns: A Meta-Analysis of Aquatic Studies. PLoS ONE 8(2): 1–6. https://doi.org/10.1371/journal.pone.0057019
- Veríssimo D, MacMillan DC, Smith RJ (2011) Toward a systematic approach for identifying conservation flagships. Conservation Letters 4(1): 1–8. https://doi.org/10.1111/j.1755-263X.2010.00151.x
- Walpole M, Leader-Williams NJ (2002) Tourism and flagship species in conservation. Biodiversity and Conservation 11(3): 543–547. https://doi.org/10.1023/A:1014864708777
- Ward M, Rhodes JR, Watson JEM, Lefevre J, Atkinson S, Possingham HP (2019) Use of surrogate species to cost-effectively prioritize conservation actions. Conservation Biology 34(3): 600–610. https://doi.org/10.1111/cobi.13430
- Westgate MJ, Barton PS, Lane PW, Lindenmayer DB (2014) Global meta-analysis reveals low consistency of biodiversity congruence relationships. Nature Communications 5(1): 1–8. https://doi.org/10.1038/ncomms4899
- Westgate MJ, Tulloch AIT, Barton PS, Pierson JC, Lindenmayer DB (2017) Optimal taxonomic groups for biodiversity assessment: A meta-analytic approach. Ecography 40(4): 539–548. https://doi.org/10.1111/ecog.02318
- Wolters V, Bengtsson J, Zaitsev AS (2006) Relationship among the species richness of different taxa. Ecology 87(8): 1886–1895. https://doi.org/10.1890/0012-9658(2006)87[1886:RATSRO]2.0.CO;2
- Wright AJ, Veríssimo D, Pilfold K, Parsons ECM, Ventre K, Cousins J, Jefferson R, Koldewey H, Llewellyn F, Mckinley E (2015) Competitive outreach in the 21st century: Why we need conservation marketing. Ocean and Coastal Management 115: 41–48. https://doi.org/10.1016/j.ocecoaman.2015.06.029
- Xu W, Viña A, Qi Z, Ouyang Z, Liu J, Liu W, Wan H (2014) Evaluating conservation effectiveness of nature reserves established for surrogate species: Case of a giant panda nature reserve in Qinling Mountains, China. Chinese Geographical Science 24(1): 60–70. https://doi.org/10.1007/s11769-014-0656-7
- Zacharias MA, Roff JC (2001) Use of focal species in marine conservation and management: A review and critique. Aquatic Conservation 11(1): 59–76. https://doi.org/10.1002/aqc.429
- Žáková Kroupova Z, Havlikova M, Halova P, Maly M (2016) Economic valuation of mountain landscapes and ecosystems: A meta-analysis of case studies. AGRIS On-Line Papers in Economics and Informatics 8(03): 103–112. https://doi.org/10.7160/aol.2016.080310
Supplementary material
Online Appendix
Data type: appendix
Explanation note: Content of the Online Appendix 1. The type of articles included in the overview of reviews for both WTP-studies and surrogacy literature (Table