Research Article |
|
Corresponding author: Van Vien Pham ( vpham@gwdg.de ) Academic editor: M. Nazre
© 2022 Van Vien Pham, Christian Ammer, Peter Annighöfer, Steffi Heinrichs.
This is an open access article distributed under the terms of the Creative Commons Attribution License (CC BY 4.0), which permits unrestricted use, distribution, and reproduction in any medium, provided the original author and source are credited.
Citation:
Pham VV, Ammer C, Annighöfer P, Heinrichs S (2022) Plant species diversity and composition in limestone forests of the Vietnamese Cat Ba National Park. Nature Conservation 50: 23-64. https://doi.org/10.3897/natureconservation.50.86490
|
Abstract
Plant species diversity and composition play crucial roles in many ecosystem services and are largely influenced by environmental conditions, as well as natural and/or anthropogenic disturbances. However, our knowledge of the drivers of plant species diversity and composition in the limestone forests of Vietnam, a hotspot of biodiversity, is limited. To fill this knowledge gap, we surveyed plant species in the Cat Ba National Park (CBNP), located on a limestone archipelago. We hypothesised that: (1) topography, accessibility and spatial isolation drive the diversity and composition of plant communities in the CBNP and that (2) isolated areas contribute to high floristic regional diversity by supporting unique species assemblages. We expected high tree species diversity within the tropical limestone forests of the CBNP, but also that: (3) the abundance of non-tree species negatively affects tree regeneration diversity and abundance. Data were obtained from 90 random sample plots (500 m2) and 450 sub-sample plots (25 m2) in three areas of the CBNP. We differentiated four different plant species communities and found a total of 302 species belonging to 112 families. Tree species contributed 50% to total species richness. The distribution of different plant communities in the CBNP was driven mainly by topography; that is, the percentage of rock surface and slope and concomitant differences in soil depth. Contrary to our expectations, isolated areas did not contribute greatly to the CBNP’s plant species diversity. It seems that isolated areas and, as in our case, rough topography, may act as natural barriers to seed dispersal, creating an environmental filter for tree species. Across the CBNP, there was no effect of non-tree species on tree species regeneration, but regeneration patterns differed between communities. In species-rich communities growing under favourable site conditions (e.g. low rock surface and slope), greater coverage by non-tree species had an increasingly negative effect on tree species richness and abundance in the regeneration layer. The opposite was observed in communities growing under harsh site conditions. We conclude that plant species diversity in the CBNP is high, particularly in easily accessible lowland areas where tree species contribute greatly to biodiversity. However, here, non-tree species can even restrict tree regeneration.
Keywords
Gamma diversity, heterogeneity-diversity relationship, plant species community, plant species diversity
Introduction
Plant species diversity and composition are important drivers of forest ecosystem functions and services. They provide habitat and resources for different taxonomic groups and food resources (e.g. fruits) for humans (
According to one fundamental ecological theory, environmental heterogeneity is crucial for the diversity, distribution and growth of plant species communities (
In addition to species diversity, interactions amongst vertical forest layers are important for forest development and functioning. The overstorey layer affects the understorey primarily via canopy cover (
Tropical and subtropical forests are known as remarkably diverse ecosystems and are considered biodiversity hotspots (
Our study aims to contribute to the knowledge of the autecology of different plant species and plant species assemblages within limestone forests of Vietnam as a potential basis for future monitoring and conservation programmes.
Methods
Study site
The CBNP is situated on Cat Ba Island, in the Tonkin Gulf, northern Vietnam. It lies ca. 45 km east of Haiphong City and 150 km south-east of Hanoi. Geographical coordinates are 20°44'N to 20°55'N (DM), 106°54'E to 107°10'E (DM) (Fig.

Location of Cat Ba National Park (CBNP), Haiphong, Vietnam. We collected data at three different study sites: MSA, a mid-slope area; LLA, a lowland area; ISA, an isolated area; 4, 5 and 6 are other restricted areas in the CBNP that were not considered for this study (
The CBNP is located on a limestone archipelago that consists of 366 islands and islets (
Various ecosystems and forest types can be found in the CBNP and these include evergreen forests on limestone, wetland forest ecosystems in steep mountain valleys, mangrove forests, coral reefs and cave systems (
In 2004, Cat Ba Island was designated a UNESCO biosphere reserve because of its diverse flora and fauna (
Data sampling
We used the simple random sampling technique (

Based on this technique, a total of 90 random sample plots were created (30 plots in each of the three protected areas (LLA, MSA and ISA)). Each sample plot area was 500 m2 in size (20 m × 25 m).
Overstorey tree layer
Within each sample plot, diameter at breast height (DBH) and height of all overstorey trees with DBH ≥ 5 cm were measured. We identified each individual tree to the species level. We defined species of the overstorey tree layer as tree species that now or in the future will be able to form the upper forest canopy. Botanists of the
Northeast College of Agriculture and Forest (AFC)
and from Cat Ba National Park assisted with identification. All recorded tree species were assigned to categories of threat according to the IUCN Red List categories (
Regeneration layer
We assigned individual trees, potentially able to reach the upper canopy in the future, with DBH < 5 cm to the regeneration layer. Regeneration was recorded on five subplots, which were established on five positions within each sample plot (Fig.
Non-tree species layer
We additionally assigned plant species, other than trees and irrespective of their height, to the forest understorey and identified them to species level. We defined this layer as the non-tree species layer. Species included shrubs (even > 5 cm DBH), bamboo species, vines, medical plants and edible plants (
Growth site conditions
To characterise the growing conditions of plant species in the different plots and study areas, we recorded variables describing topography, soil conditions and light availability, as well as former impacts by humans.
As topographic variables (T), we recorded slope (T_SL), elevation (T_Ele) and percentage of rock surface area (T_RS) per sample plot. At the centre of each sample plot, the slope was measured with an inclinometer. Longitude, latitude and elevation were measured with a Garmin GPSMAP 64st device. A visually estimated mean value of rock exposure across the five subplots resulted in values for rock surface area (T_RS) per plot (%).
Soil conditions
(S) included chemical and physical properties. Soil samples were collected at the centre of each sample plot using a soil auger (diameter 10 cm). A 20 cm core of the topsoil layer was sampled to analyse absolute soil moisture content (S_SM), soil humus content (S_SH), base saturation (S_BS), pH (S_pH), hydrolytic acidity (S_HA), total cation exchange capacity (S_CEC), soil texture (S_Sand, S_Silt, S_Clay) and percentage of rock in soil (S_RS). Soil depth (S_SD) was measured with a steel rod on the five subplots; the five values were then averaged. Samples were analysed in the soil laboratory of the Vietnam National University of Forestry. For details, see
Light availability
(L) was measured with a solariscope (SOL 300B, Ing.-Büro Behling, Wedemark) as an indirect site factor (L_ISF), which is the proportion of diffuse sunlight as a percentage of open field conditions. Measurements were conducted at 2 m above the ground on three diagonal subplots across the sample plot (Fig.
After its establishment in 1986, the board of directors of the CBNP tried to reduce the human impact in the core zones of the CBNP by moving people outside the core zones. To date, however, many villages are still located close to the CBNP. Hence, activities of the local people, such as illegal logging and hunting, can still be detected. To roughly quantify a possible human impact (H), we counted footpaths (H_FP), tree stumps (H_STP) and poacher traps to catch animals (H_AT) on the plots as proxies for human activities.
Data analysis
To analyse plant species composition in the CBNP and to identify different forest communities, we used hierarchical cluster analysis with Ward’s method using the function ‘vegdist()’ to create a Bray Curtis distance matrix, the function ‘hclust()’ to conduct a cluster analysis and the function ‘cutree()’ to draw a community dendrogram. These functions are implemented in the ‘vegan’ package in R (
To display the spatial distribution of communities in multidimensional space, we used the non-metric multidimensional scaling (NMDS) ordination method, based on abundance data. In the first step, we used the ‘metaMDS()’ function to run an NMDS and then used the ‘envfit()’ function to add environmental data into the NMDS graph using ‘vegan’ in R . We included all vegetation layers into the NMDS. Tree species of the overstorey and regeneration layers were combined to avoid duplication of species names.
To determine indicator species for identified forest communities, we used the function ‘multipatt()’ in the package ‘indicspecies’ (
To determine factors affecting community distribution in the CBNP, we correlated the NDMS axes’ values with the environmental factors and human impact indicators. The function ‘anova()’ following a post-hoc Tukey-test with function ‘glht()’ in ‘multcomp’ package was used to compare these variables amongst communities.
We additionally applied different selection operators to build decision trees to weigh the predictors that characterised plant species communities (= the response). Forward selection of the predictors performed best. This method starts with an empty model and adds predictors to explain the response. Performance is estimated in each round using cross-validation. Only predictors with the highest performance increase are kept, then a new round is started. The maximum number of attributes to add was limited to seven to avoid overfitting; the iteration was aborted when performance no longer increased. This yielded a decision tree classifying the plant species communities. Classification trees represent a robust, non-parametric, binary procedure that partitions variance in the variation of communities through a series of splits in more homogeneous groups based on environmental factors or human impact variables (
We contrasted plant species richness amongst the detected forest communities, species groups (tree and non-tree-species) and vegetation layers (overstorey tree, regeneration, non-tree layer) at different spatial scales. For alpha diversity, we compared plot-based species richness amongst communities using the ‘anova()’ function, followed by a post-hoc Tukey-test with function ‘glht()’ in the ‘multcomp’ package. To compare total species diversity in the identified communities, we used the ‘iNEXT’ package in R (
To investigate how much each detected forest community contributed to the gamma diversity of the CBNP, we contrasted the estimated species pool of different combinations of communities to the species pool estimated for a combination of all detected communities. We also estimated the gamma diversity of tree and non-tree species of the CBNP and of different forest communities.
The relationship between non-tree species and the overstorey tree layer and between non-tree species and the regeneration layer was checked using linear regression models. We investigated the relationships across communities and for each community separately.
All statistical analyses were conducted using the statistical software R version 3.4.2 (R Core Team 2017). The level of significance for all statistical inferences was defined as p-value < 0.05.
Results
Forest communities of the CBNP
We identified four main communities that differ distinctly in species composition in Cat Ba National Park, (Fig.
Indicator species of the four identified forest communities. The eponymous tree and non-tree indicator species are given in bold. The growth form of each species is given as species group. See Appendix
| Species | Species group | Indicator value | p-value |
|---|---|---|---|
| Saraca dives + Calamus tetradactylus community (SCt) | |||
| Saraca dives | Tree | 0.789 | 0.001 |
| Calamus tetradactylus | Vine | 0.681 | 0.001 |
| Peltophorum pterocarpum | Tree | 0.630 | 0.001 |
| Ardisia gigantifolia | Shrub, medical plant | 0.592 | 0.001 |
| Garcinia oblongifolia | Tree | 0.582 | 0.002 |
| Gomphandra tonkinensis | Shrub, medical plant | 0.496 | 0.002 |
| Cinnamomum ovantum | Tree | 0.469 | 0.011 |
| Bauhinia coccinea | Shrub | 0.445 | 0.008 |
| Aglaia spectabilis | Tree | 0.444 | 0.013 |
| Ardisia silvestris | Shrub, medical plant | 0.417 | 0.007 |
| Mussaenda crosa | Shrub | 0.401 | 0.014 |
| Phoebe pallida | Tree | 0.373 | 0.041 |
| Caryota obtusa | Shrub | 0.369 | 0.037 |
| Phytele phantoideae | Shrub | 0.369 | 0.034 |
| Sterculia lanceolata + Chloris barbata community (SCb) | |||
| Sterculia lanceolata | Tree | 0.694 | 0.001 |
| Paramichelia baillonii | Tree | 0.520 | 0.002 |
| Zanthoxylum nitidum | Tree | 0.500 | 0.001 |
| Chloris barbata | Grass | 0.423 | 0.003 |
| Convolvulus parviflorus | Shrub | 0.380 | 0.044 |
| Markhamia cauda-felina | Tree | 0.378 | 0.035 |
| Ficus superba + Acanthus ebracteatus community (FAe) | |||
| Acanthus ebracteatus | Shrub | 0.931 | 0.001 |
| Ficus superba | Tree | 0.418 | 0.009 |
| Bursera tonkinensis | Tree | 0.401 | 0.049 |
| Connarus paniculatus | Vine | 0.387 | 0.013 |
| Clausena excavata + Desmos cochinchinensis community (CDc) | |||
| Clausena excavata | Tree | 0.800 | 0.001 |
| Microcos paniculata | Tree | 0.775 | 0.001 |
| Desmos cochinchinensis | Vine | 0.644 | 0.001 |
| Zephyranthes carinata | Herb | 0.541 | 0.002 |
| Helixanthera parasitica | Shrub | 0.468 | 0.015 |
| Pandanus tectorius | Shrub | 0.448 | 0.008 |
| Blumea lacineata | Herb | 0.402 | 0.024 |
| Syzygium jambos | Tree | 0.400 | 0.032 |
| Morinda citrifolia | Tree | 0.387 | 0.017 |
| Cnestis palala | Vine, medical plant | 0.374 | 0.049 |

Spatial distribution of communities in NMDS analysis. The ellipses show the confidence levels at 95% of covariance of each community.
Ordination revealed that the SCt community was found mainly in the lowland area (LLA). The SCb community characterised a transition from the lowland to mid-slope area. The FAe community was associated with the mid-slope area and the CDc community with the isolated area (Fig.
Forest structure and abiotic conditions of the forest communities
Forest structure differed amongst the four communities. On average, we found the lowest diameter at breast height (DBH), height (Ht), basal area (BA) and volume (Vol) in the FAe community, while the SCt community was characterised by the highest mean volume, DBH, basal area and height. The SCb community had the highest tree species richness, whereas the CDc community was the most species-poor in the overstorey layer (Table
Forest structure of the different forest communities in the CBNP. The highest and lowest values are written in bold. Different letters indicate statistically significant differences amongst communities.
| SCt community | SCb community | FAe community | CDc community | |
|---|---|---|---|---|
| DBH (cm) | 24.1 ± 4.47c | 22.1 ± 5.22b | 18.5 ± 4.83a | 22.1 ± 3.68b |
| Ht (m) | 12.58 ± 2.23c | 10.68 ± 1.52b | 9.32 ± 1.9a | 10.52 ± 1.47b |
| BA (m2.ha-1) | 36.4 ± 17.0c | 29.1 ± 19.7b | 21.1 ± 15.5a | 27.8 ± 11.5b |
| Vol (m3.ha-1) | 279.23 ± 160c | 229.27 ± 193b | 163.06 ± 157a | 209.51 ± 108b |
| Tree species richness | 15.4 ± 6.1b | 15.5 ± 6.0b | 13.4 ± 2.8a | 12.9 ± 2.6a |
Community comparisons, as well as the decision tree analysis, showed that the communities FAe and CDc were associated with steeper slopes and a high percentage of rock surface area (Fig.
Mean values (± standard deviation) of environmental and human impact factors of the four communities. Superscript letters indicate statistically significant differences amongst the four communities. The highest and lowest values for each variable are written in bold.
| Indicators | SCt community | SCb community | FAe community | CDc community |
|---|---|---|---|---|
| Number of sample plots | 22 | 28 | 20 | 20 |
| T_SL (Slope) (°) | 11.7 ± 8.77a | 14.4 ± 9.44b | 26.1 ± 10.82d | 22.3 ± 8.42c |
| T_RS (Rock surface) (%) | 20 ± 17.1a | 35.6 ± 23.1b | 71.9 ± 19.3d | 81.9 ± 12.6c |
| T_Ele (Elevation) (m) | 74 ± 31.9b | 62.7 ± 35.7a | 87.2 ± 42.7c | 89.1 ± 42.8c |
| S_SD (Soil depth) (cm) | 79.8 ± 39.0c | 76.5 ± 34.0b | 32.3 ± 17.9a | 34.6 ± 23.9a |
| S_SR (Rock in soil) (%) | 12.98 ± 23.05c | 8.74 ± 14.85b | 8.53 ± 6.17b | 5.83 ± 2.96a |
| S_SM (Soil moisture) (%) | 5.76 ± 5.5a | 8.24 ± 5.2b | 14.12 ± 3.9d | 13.24 ± 3.3c |
| S_Sand (Sand content) (%) | 31.5 ± 10.9c | 29.8 ± 11.6b | 25.2 ± 10a | 38.6 ± 16.6d |
| S_Clay (Clay content) (%) | 27.1 ± 11.19a | 28.8 ± 7.88b | 33.8 ± 5.99b | 27.5 ± 9.21a |
| S_SH (Soil humus content) | 2.8 ± 1.47b | 2.46 ± 1.02a | 3.91 ± 1.58c | 4.59 ± 1.02d |
| S_pH (pH value) | 4.77 ± 0.52a | 5.10 ± 0.52b | 5.58 ± 0.46d | 5.47 ± 0.28c |
| S_HA (Soil acidity) | 5.20 ± 2.23b | 4.57 ± 1.72a | 4.73 ± 1.74a | 5.39 ± 2.47b |
| S_BS (Base saturation) (%) | 55.5 ± 13.05a | 59.9 ± 10.82b | 63.7 ± 10.22d | 61.9 ± 9.09c |
| S_CEC (Cation exchange capacity) | 6.13 ± 1.47a | 6.63 ± 1.30b | 8.07 ± 1.20c | 8.28 ± 0.80d |
| H_FP (Footpaths) (N.plot-1) | 1.27 ± 0.45c | 1.26 ± 0.49c | 1.07 ± 0.53b | 1.00 ± 0.0a |
| H_Stp (Stumps) (N.plot-1) | 0.16 ± 0.37b | 0.15 ± 0.36b | 0.0 ± 0.0a | 0.0 ± 0.0a |
| H_AT (Animal traps) (N.plot-1) | 0.62 ± 1.38b | 1.01 ± 1.79d | 0.78 ± 1.56c | 0.43 ± 1.12a |
| L_ISF (Indirect site factor) (%) | 8.80 ± 2.96b | 9.56 ± 8.81c | 8.12 ± 2.15a | 9.22 ± 3.30bc |

Correlation of environmental and human impact factors if significant (T = topographic variables, S = soil variables, H = human impact) with the NMDS axes. Length of the arrow indicates the strength of the correlation. Arrows in the same direction indicate a positive correlation of the variables with each other and a unidirectional response to NMDS axes. All variables that significantly correlated with the axes (p-value < 0.05) are shown. ISA = isolated area; LLA = lowland area; MSA = mid-slope area. The abbreviations for environmental and human disturbance factors are defined in Table
Differences in environmental factors among communities were also reflected in the differences in environmental factors among the study sites in which the communities were mainly located (see Figs
Patterns of plant species diversity of the forest communities
Across communities, the non-tree species layer was, on average, more species-rich than the overstorey and regeneration layers, with the highest non-tree species richness found in the SCb community (Fig.

Boxplots of species richness of the three investigated layers in each forest community. Letters indicate statistically significant differences amongst communities. SCt; Saraca dives + Calamus tetradactylus community. SCb; Sterculia lanceolata + Chloris barbata community. FAe; Ficus superba + Acanthus ebracteatus community. CDc; Clausena excavata + Desmos cochinchinensis community.
Gamma diversity estimations identified significantly higher values for the communities SCt and SCb compared to the communities FAe and CDc. For the Hill number q = 2, the SCb community, which characterised the transition from the lowland to the mid-slope area, was significantly more diverse than the other three communities; confidence intervals do not overlap. For all Hill numbers, the forest community associated mainly with the isolated area (CDc) had the lowest gamma diversity (Fig.

Estimated gamma diversity for different Hill numbers and forest communities. q = 0: species richness; q = 1: Shannon diversity; q = 2: Simpson diversity. The red colour represents the estimated gamma diversity when all communities are considered for estimation. Yellow-green: Saraca dives + Calamus tetradactylus community (SCt). Green: Sterculia lanceolata + Chloris barbata community (SCb). Light-blue: Ficus superba + Acanthus ebracteatus community (FAe). Pink: Clausena excavata + Desmos cochinchinensis community (CDc). Graphs were extrapolated to a sample size of 90 plots.
When investigating the importance of each community to CBNP gamma diversity, we first estimated the species pools of different combinations of communities. We found that the SCb and SCt communities were most important for regional gamma diversity. When these communities were eliminated from community combinations, gamma diversity was greatly reduced as compared to the total species pool and to other community combinations (Appendix
Gamma diversity patterns of the different communities were driven in large part by tree species (Fig.

Gamma diversity patterns of tree species and non-tree species of the different communities. The graphs show species richness (Hill number q = 0, including 95% confidence interval). Red: all four communities, Yellow-green: Saraca dives + Calamus tetradactylus community (SCt), Green: Sterculia lanceolata + Chloris barbata community (SCb), Light-blue: Ficus superba + Acanthus ebracteatus community (FAe), Pink: Clausena excavata + Desmos cochinchinensis community (CDc). For Hill numbers q = 1 and q = 2, see Appendix
Tree and non-tree species contributed nearly equally to the diversity of the CBNP (Table
Estimated species pool by species group and community for q = 0. The value in brackets indicates the 95% confidence interval.
| Layer | All communities | SCt community | SCb community | FAe community | CDc community |
|---|---|---|---|---|---|
| All species | 367.7 | 316.7 | 317.0 | 211.4 | 178 |
| (339.3 ÷ 417.7) | (261.6 ÷ 415.5) | (275.5 ÷ 391.5) | (178.2 ÷ 275.8) | (146.4 ÷ 249.3) | |
| Tree species | 190.8 | 190.5 | 175.7 | 87 | 73.2 |
| (170.4 ÷ 235.0) | (144.7 ÷ 290.7) | (140.7–253.4) | (75.6–118.1) | (61.4 ÷ 110.7) | |
| Non-tree species | 177.6 | 130.2 | 145.7 | 133.1 | 110.6 |
| (161.9 ÷ 212.4) | (105.0 ÷ 189.0) | (126.2–190.5) | (98.9 ÷ 214.6) | (80.5 ÷ 199.4) |
Relationships between vertical forest layers
We did not find a significant relationship between species richness of the non-tree layer and that of the tree regeneration layer. We also found no effect of species richness of the overstorey tree layer on species richness of the non-tree species layer or the regeneration layer (Fig.

Linear regression models of plot-based species richness relating: a species richness of the non-tree species layer and species richness of the regeneration layer b species richness of the overstorey tree layer and species richness of the non-tree species layer and c species richness of the overstorey tree layer and species richness of the regeneration layer. The shaded area indicates the 95% confidence interval.
Across all communities, there was also no significant effect of the coverage of the non-tree species layer on the species richness or abundance of the regeneration layer (Fig.

Linear regression models of the coverage of non-tree species and species richness and abundance of the tree regeneration layer. Graphs (a) and (c) show the relationship between the coverage of non-tree species with the abundance and species richness of tree regeneration across all communities, graphs (b) and (d) for the four communities. Dashed lines show statistically non-significant, solid lines show significant correlations. To improve visibility, we did not include the confidence intervals for (b) and (d).
We did not observe any significant effect of species richness or coverage of the non-tree species layer on tree abundance or richness of threatened tree species in the regeneration layer (Appendix
Discussion
Topographic heterogeneity drives the spatial distribution of forest communities in the CBNP
We distinguished four forest communities in the CBNP that differ in forest structure and are characterised by different environmental conditions (Fig.
We found that the SCt and SCb communities occurred mainly on sites characterised by deep soils, whereas the FAe and CDc communities were found on sites with rough terrain (steep slopes and high rock surface), but with relatively high soil nutrient content (high soil humus content and CEC) (Fig.
Topographic heterogeneity can also influence light availability, an important determinant of plant species distribution (
Although indicators of human impact could not be clearly connected to plant species distribution, observed differences in the forest communities of the different study areas could have reflected human influence, which was strongest in the lowland area. In the lowland area, with the communities SCt and SCb, species richness was highest (Figs
We identified several indicator species for the four forest communities that provided valuable information on species-environment relationships. While species of the communities SCt and SCb seemed to be restricted to deep soils, indicator species in the FAe and CDc were able to tolerate harsh soil conditions, such as a high percentage of rock surface and shallow mineral soils (
Thus, our study underscores the value of using identified indicator species or groups of species for an overall assessment of the environmental conditions in tropical limestone forests of Southeast Asia. By monitoring certain indicator species, shifts in environmental conditions can be reliably detected.
Differences in forest community composition do not drive the biodiversity of the CBNP
We identified in total 302 species belonging to 112 families in the CBNP (Table
In contrast to our expectations, the heterogeneity we found in forest community composition did not appear to drive overall plant species diversity of the CBNP. The linkage between isolation and species diversity has been investigated in previous studies (
Our results also confirm the theory that larger areas boost high species diversity. The two species-rich SCt and SCb communities (Figs
The species-rich SCb and SCt communities were associated with greater soil depth, while the percentage of rock surface and slope were correlated with species-poorer communities (FAe and CDc communities) (Fig.
Humans can have a huge influence on floristic diversity; there are numerous examples from around the world. For example,
Relationship between vertical forest layers
Across communities, we found no interactions amongst forest layers (
Competition between tree regeneration and non-tree species in the SCt and SCb communities may also have resulted from former canopy disturbances. Increased light levels induce understorey growth with potential negative effects on tree regeneration. The light-demanding weed species Chloris barbata, identified as an indicator species in the SCb community, may be an indication of former disturbances as are the higher values of human impact indicators in SCt and SCb. However, the light availability measured for this study was around 9.17% ± 6.4% (mean ± sd) and homogeneous across communities.
Limitations of the study
Although we have considered many environmental factors and indicators of human impact to explain plant species composition and diversity in the CBNP, we acknowledge some shortcomings. We did not explicitly consider climatic factors (
Conclusions
Our study demonstrates that plant species composition and diversity in the CBNP vary strongly at the regional scale. Contrary to our expectations, the isolated island site did not contribute much to total plant species richness. Species found there seemed well adapted to the harsh conditions, but were also found at other sites and can, therefore, be classified as generalists.
We also showed that environmental factors are important drivers of plant species composition and species diversity in the CBNP with non-tree species contributing about 50% to total species richness. Our data indicate that this species group is less prone than tree species to environmental filtering. Furthermore, the coverage of non-tree species negatively impacted species richness of tree regeneration on sites with sufficient water and nutrient availability (Sterculia lanceolata + Chloris barbata and Saraca dives + Calamus tetradactylus community). Under harsh environmental conditions, non-tree species appeared to facilitate tree regeneration richness of the Ficus superba + Acanthus ebracteatus community, underscoring the important function of non-tree species to forest development in these tropical forests on limestone. The Sterculia lanceolata + Chloris barbata and the Saraca dives + Calamus tetradactylus community, found mainly in lowlands in transition to mid-slope conditions, contribute most to plant species diversity in the CBNP.
From these findings, we conclude that plant species composition and diversity in the CBNP is rich, with tree and non-tree species contributing equally to this diversity, but with higher tree species diversity in the lowlands. For future conservation management, the protection of tree species, for example, from illegal logging activities, should be one priority for managers of the CBNP. This is particularly important as the area most accessible to the local population is characterised by tree species-rich forest communities. In general, the main island contributes most to plant species richness in the CNBP due to the availability of microsites and connectivity amongst habitats. Thus, monitoring of species diversity and composition and conservation management to prevent fragmentation should focus on these areas. Here and beyond the CBNP, the dynamics of the identified indicator species groups will help to detect future changes in environmental conditions.
The identified forest communities with their indicator species assemblages provide fundamental information on the interactions between plant species distribution and environmental conditions in limestone forests of Vietnam and may also help to characterise the limestone forests beyond the borders of the CBNP.
Acknowledgements
This study was supported by the Vietnamese Government Scholarship (decision No.911), the Rufford Small Grants Foundation and the Georg-August Universität Göttingen, Silviculture and Forest Ecology of the Temperate Zones. The Open Access Publication Funds of the Georg-August-University Göttingen support open access publication. We are grateful to the directors of the Cat Ba National Park for their steady support during the fieldwork. In particular, we want to thank Hoang Van Thap, Doan Ngoc Son, Hoang Van Cau, Nguyen Van Khu, Nguyen Van Luc, Nguyen Van Thiep and Nguyen Van Tu for their fieldwork assistance. Thanks go also to Pham Ba Su and Doan Ngoc Son, who helped with tree identification; and to Tran Thi Hang, who helped with analysing the soil samples. We are grateful for linguistic corrections by Kathleen Regan (USA).
References
- Assefa A, Demissew S, Woldu Z (2013) Floristic composition, structure and regeneration status of Masha forest, south-west Ethiopia. African Journal of Ecology 52(2): 151–162. https://doi.org/10.1111/aje.12098
- Bailey D, Schmidt-Entling MH, Eberhart P, Herrmann JD, Hofer G, Kormann U, Herzog F (2010) Effects of habitat amount and isolation on biodiversity in fragmented traditional orchards. Journal of Applied Ecology 47(5): 1003–1013. https://doi.org/10.1111/j.1365-2664.2010.01858.x
- Bayliss-Smith T, Hviding E, Whitmore T (2003) Rainforest composition and histories of human disturbance in Solomon Islands. Ambio 32(5): 346–352. https://doi.org/10.1579/0044-7447-32.5.346
- Behera SK, Misra MK (2005) Floristic and Structure of the Herbaceous Vegetation of Four Recovering Forest Stands in the Eastern Ghats of India. Biodiversity and Conservation 15(7): 2263–2285. https://doi.org/10.1007/s10531-004-8215-7
- Berger AL, Puettmann KJ (2000) Overstory Composition and Stand Structure Influence Herbaceous Plant Diversity in the Mixed Aspen Forest of Northern Minnesota. American Midland Naturalist 143(1): 111–125. https://doi.org/10.1674/0003-0031(2000)143[0111:OCASSI]2.0.CO;2
- Bertness MD, Callaway R (1994) Positive interactions in communities. Trends in Ecology & Evolution 9(5): 191–193. https://doi.org/10.1016/0169-5347(94)90088-4
- Blanc L, Maury-Lechon G, Pascal JP (2000) Structure, floristic composition and natural regeneration in the forests of Cat Tien National Park, Vietnam: An analysis of the successional trends. Journal of Biogeography 27(1): 141–157. https://doi.org/10.1046/j.1365-2699.2000.00347.x
- Both S, Fang T, Bohnke M, Bruelheide H, Geissler C, Kuhn P, Scholten T, Trogisch S, Erfmeier A (2011) Lack of tree layer control on herb layer characteristics in a subtropical forest, China. Journal of Vegetation Science 22(6): 1120–1131. https://doi.org/10.1111/j.1654-1103.2011.01324.x
- Carle J, Holmgren P (2003) Definitions related to planted forests FAO, 16 pp.
- CBNP (2005) Inventory and Planning for Cat Ba National Park from 2006 to 2010 and vision to 2020. Cat Ba National Park, Haiphong, Vietnam, 123 pp.
- CBNP (2007) Biodiversity Information of Cat Ba National Park, Vietnam. Institute of Ecology and Resources, Cat Ba Nation Park, Haiphong, Vietnam, 203 pp.
- Chao A, Jost L (2012) Coverage-based rarefaction and extrapolation: Standardizing samples by completeness rather than size. Ecology 93(12): 2533–2547. https://doi.org/10.1890/11-1952.1
- Chao A, Gotelli NJ, Hsieh TC, Sander EL, Ma KH, Colwell RK, Ellison AM (2014) Rarefaction and extrapolation with Hill numbers: A framework for sampling and estimation in species diversity studies. Ecological Monographs 84(1): 45–67. https://doi.org/10.1890/13-0133.1
- Chazdon RL (2003) Tropical forest recovery: Legacies of human impact and natural disturbances. Perspectives in Plant Ecology, Evolution and Systematics 6(1–2): 51–71. https://doi.org/10.1078/1433-8319-00042
- Chytrý M, Danihelka J, Axmanová I, Božková J, Hettenbergerová E, Li C-F, Rozbrojová Z, Sekulová L, Tichý L, Vymazalová M, Zelený D (2010) Floristic diversity of an eastern Mediterranean dwarf shrubland: The importance of soil pH. Journal of Vegetation Science 21(6): 1125–1137. https://doi.org/10.1111/j.1654-1103.2010.01212.x
- Cicuzza D, Kromer T, Poulsen AD, Abrahamczyk S, Delhotal T, Piedra HM, Kessler M (2013) A transcontinental comparison of the diversity and composition of tropical forest understory herb assemblages. Biodiversity and Conservation 22(3): 755–772. https://doi.org/10.1007/s10531-013-0447-y
- Cutler DR, Edwards Jr TC, Beard KH, Cutler A, Hess KT, Gibson J, Lawler JJ (2007) Random forests for classification in ecology. Ecology 88(11): 2783–2792. https://doi.org/10.1890/07-0539.1
- Dao T, Hölscher D (2018) Impact of Non-Timber Forest Product Use on the Tree Community in North-Western Vietnam. Forests 9(7): e431. [1–15] https://doi.org/10.3390/f9070431
- De Cáceres M, Legendre P (2009) Associations between species and groups of sites: indices and statistical inference. Ecology 90(12): 3566–3574. https://doi.org/10.1890/08-1823.1
- De’ath G, Fabricius KE (2000) Classification and regression trees: A powerful yet simple technique for ecological data analysis. Ecology 81(11): 3178–3192. https://doi.org/10.1890/0012-9658(2000)081[3178:CARTAP]2.0.CO;2
- Do HTT, Grant JC, Trinh BN, Zimmer HC, Nichols JD (2017) Diversity depends on scale in the forests of the Central Highlands of Vietnam. Journal of Asia-Pacific Biodiversity 10(4): 472–488. https://doi.org/10.1016/j.japb.2017.08.008
- EI-Bana MI (2009) Factors Affecting the Floristic Diversity and Nestedness in the Islets of Lake Bardawil, North Sinai, Egypt: Implications for Conservation. Journal of Coastal Conservation 13: 25–37. https://doi.org/10.1007/s11852-009-0049-8
- Fang ZQ, Bao WK, Yan XL, Liu X (2014) Understory structure and vascular plant diversity in naturally regenerated deciduous forests and spruce plantations on similar clear-cuts: Implications for forest regeneration strategy selection. Forests 5(4): 715–743. https://doi.org/10.3390/f5040715
- Fangliang H, Legendre P, Frankie JVL (1997) Distribution patterns of tree species in a Malaysian tropical rain forest. Vegetation Science 8(1): 105–114. https://doi.org/10.2307/3237248
- Ferraz EMN, Araújo EdL, da Silva SI (2004) Floristic similarities between lowland and montane areas of atlantic coastal forest in Northeastern Brazil. Plant Ecology 174(1): 59–70. https://doi.org/10.1023/B:VEGE.0000046062.77560.f5
- FSIV (2009) Vietnam Forestry outlook study. Food and agriculture organization of the united nations regional office for Asia and the Pacific. Bangkok, Thailand, 72 pp.
- Galeano G, Suarez S, Balslev H (1998) Vascular plant species count in a wet forest in the Chocó area on the Pacific coast of Colombia. Biodiversity and Conservation 7(12): 1563–1575. https://doi.org/10.1023/A:1008802624275
- Gentry AH, Dodson C (1987) Contribution of nontrees to species richness of a tropical rain forest. Biotropica 19(2): 149–156. https://doi.org/10.2307/2388737
- Guo YL, Wang B, Mallik AU, Huang FZ, Xiang WS, Ding T, Wen SJ, Lu SH, Li DX, He YL, Li XK (2017) Topographic species-habitat associations of tree species in a heterogeneous tropical karst seasonal rain forest, China. Journal of Plant Ecology 10(3): 450–460. https://doi.org/10.1093/jpe/rtw057
- Hill JL, Curran PJ (2003) Area, shape and isolation of tropical forest fragments: Effects on tree species diversity and implications for conservation. Journal of Biogeography 30(9): 1391–1403. https://doi.org/10.1046/j.1365-2699.2003.00930.x
- Holl KD, Stout VM, Reid JL, Zahawi RA (2013) Testing heterogeneity-diversity relationships in tropical forest restoration. Oecologia 173(2): 569–578. https://doi.org/10.1007/s00442-013-2632-9
- Holm LG, Pancho JV, Herberger JP, Plucknett DL (1979) A Geographical Atlas of World Weeds. John Wiley and Sons, New York, NY, USA.
- Holmgren M, Scheffer M, Huston MA (1997) The interplay of facilitation and competition in plant communities. Ecology 78(7): 1966–1975. https://doi.org/10.1890/0012-9658(1997)078[1966:TIOFAC]2.0.CO;2
- Hothorn T, Bretz F, Westfall P (2008) Simultaneous inference in general parametric models. Biometrical Journal. Biometrische Zeitschrift 50(3): 346–363. https://doi.org/10.1002/bimj.200810425
- Hsieh TC, Ma KH, Chao A, McInerny G (2016) iNEXT: An R package for rarefaction and extrapolation of species diversity (Hill numbers). Methods in Ecology and Evolution 7(12): 1451–1456. https://doi.org/10.1111/2041-210X.12613
- Hutchinson GE (1957) Concluding remarks. Cold Spring Harbour Symposia on Quantitative Biology 22: 415–427. https://doi.org/10.1101/SQB.1957.022.01.039
- IUCN (2017) The IUCN Red List of Threatened Species. http://www.iucnredlist.org/ [accessed 20 October 2017]
- Júnior JAP, Lopes SF, Vale VS, Arantes CS, Oliveira AP, Schiavini I (2014) Floristic patterns in understoreys under different disturbance severities in seasonal forests. Journal of Tropical Forest Science 26: 458–468.
- Kleinn C, Yihlam T, Yang H, Netra Schnell SB, Fehrmann L (2009) Forest Inventory. Goerg August Universität Göttingen, 189 pp.
- Laska MS (1997) Structure of Understory Shrub Assemblages in Adjacent Secondary and Old Growth Tropical Wet Forests, Costa Rica. Biotropica 29(1): 29–37. https://doi.org/10.1111/j.1744-7429.1997.tb00003.x
- Le MT (2006) Flora in Cat Ba National Park. Forest Inventory and Planning Institute, Hanoi, Vietnam, 17 pp.
- Lillo EP, Fernando ES, Lillo MJR (2019) Plant diversity and structure of forest habitat types on Dinagat Island, Philippines. Journal of Asia-Pacific Biodiversity 12(1): 83–105. https://doi.org/10.1016/j.japb.2018.07.003
- Linares-Palomino R, Cardona V, Hennig EI, Hensen I, Hoffmann D, Lendzion J, Soto D, Herzog SK, Kessler M (2009) Non-woody life-form contribution to vascular plant species richness in a tropical American forest. Plant Ecology 201(1): 87–99. https://doi.org/10.1007/s11258-008-9505-z
- Lusk CH, Smith B (1998) Life History Differences and Tree Species Coexistence in an Old-Growth New Zealand Rain Forest. Ecology 79(3): 795–806. https://doi.org/10.1890/0012-9658(1998)079[0795:LHDATS]2.0.CO;2
- MacArthur RH, Wilson EO (1967) The theory of island biogeography. Princeton University Press, Princeton, 203 pp.
- MARD (2006) Lâm sản ngoài gỗ. CẨM NANG NGÀNH LÂM NGHIÊP, Bộ Nông nghiệp và Phát triển Nông thôn, Hà Nội, Việt Nam, 176 pp.
- Martin-Queller E, Albert CH, Dumas PJ, Saatkamp A (2017) Islands, mainland, and terrestrial fragments: How isolation shapes plant diversity. Ecology and Evolution 7(17): 6904–6917. https://doi.org/10.1002/ece3.3150
- Mendes G, Arroyo-Rodriguez V, Almeida WR, Pinto SRR, Pillar VD, Tabarelli M (2016) Plant trait distribution and the spatial reorganization of tree assemblages in a fragmented tropical forest landscape. Plant Ecology 217(1): 31–42. https://doi.org/10.1007/s11258-015-0557-6
- Mezaka A, Bader MY, Allen NS, Mendieta-Leiva G (2020) Epiphyll specialization for leaf and forest successional stages in a tropical lowland rainforest. Journal of Vegetation Science 31(1): 118–128. https://doi.org/10.1111/jvs.12830
- Nuttle T, Royo AA, Adams MB, Carson WP (2013) Historic disturbance regimes promote tree diversity only under low browsing regimes in eastern deciduous forest. Ecological Monographs 83(1): 3–17. https://doi.org/10.1890/11-2263.1
- Oksanen J, Blanchet FG, Friendly M, Kindt R, Legendre P, McGlinn D, Minchin PR, O’Hara RB, Simpson GL, Solymos P, Stevens MHH, Szoecs E, Wagner H (2019) Community Ecology Package. Biodiversity and Conservation Vietnam. http://www.biodivn.com/2014/08/cac-vuon-quoc-gia-va-khu-bao-ton-thien-nhien-viet-nam.html [accessed May 20. 2018]
- Pham VT, Nguyen DA (2018) Biodiversity and Conservation Vietnam. http://www.biodivn.com/2014/08/cac-vuon-quoc-gia-va-khu-bao-ton-thien-nhien-viet-nam.html [accessed May 20. 2018]
- Pham VV, Ammer C, Annighöfer P (2020) The Presence of IUCN Red List Tree Species in Dependence of Site Characteristics in the Vietnamese Cat Ba National Park. Diversity (Basel) 12(3): e104. [1–17] https://doi.org/10.3390/d12030104
- Pham VV, Ammer C, Annighöfer P, Heinrichs S (2022) Tree regeneration characteristics in limestone forests of the Cat Ba National Park, Vietnam. BMC Ecology and Evolution 22(1): e6. https://doi.org/10.1186/s12862-021-01957-9
- Prieto PV, Sansevero JBB, Garbin ML, Braga JMA, Rodrigues PJFP (2014) Edge effects of linear canopy openings on understorey communities in a lowland Atlantic tropical forest. Applied Vegetation Science 17(1): 121–128. https://doi.org/10.1111/avsc.12043
- Quinn JF, Harrison SP (1988) Effects of Habitat Fragmentation and Isolation on Species Richness: Evidence from Biogeographic Patterns. Oecologia 75(1): 132–140. https://doi.org/10.1007/BF00378826
- R Core Team R (2017) R: A language and environment for statistical computing. http://www.R-project.org [accessed Septemper 28. 2017]
- Santo‐Silva EE, Benchimol M, Peres CA, Schmidtlein S (2021) Phylogenetic homogenization of Amazonian tree assemblages in forest islands after 26 years of isolation. Applied Vegetation Science 24(3): e12601. https://doi.org/10.1111/avsc.12601
- Scheffer M, van Geest GJ, Zimmer K, Jeppesen E, Søndergaard M, Butler MG, Hanson MA, Declerck S, De Meester L (2006) Small Habitat Size and Isolation Can Promote Species Richness: Second-Order Effects on Biodiversity in Shallow Lakes and Ponds. Oikos 112(1): 227–231. https://doi.org/10.1111/j.0030-1299.2006.14145.x
- Seta T, Demissew S, Woldu Z (2018) Floristic diversity and composition of the Biteyu forest in the Gurage mountain chain (Ethiopia): Implications for forest conservation. Journal of Forestry Research 30(1): 319–335. https://doi.org/10.1007/s11676-018-0623-8
- Slik JWF, Poulsen AD, Ashton PS, Cannon CH, Eichhorn KAO, Kartawinata K, Lanniari I, Nagamasu H, Nakagawa M, Van Nieuwstadt MGL, Payne J, Saridan A, Sidiyasa K, Verburg RW, Webb CO, Wilkie P (2003) A Floristic Analysis of the Lowland Dipterocarp Forests of Borneo. Journal of Biogeography 30(10): 1517–1531. https://doi.org/10.1046/j.1365-2699.2003.00967.x
- Sodhi NS, Posa MRC, Lee TM, Bickford D, Koh LP, Brook BW (2009) The state and conservation of Southeast Asian biodiversity. Biodiversity and Conservation 19(2): 317–328. https://doi.org/10.1007/s10531-009-9607-5
- Sorrenti S (2017) Non-wood forest products in international statistical systems. Non-wood Forest Products Series. FAO, Rome, 130 pp.
- Sun BL, Zhang CQ, Lowry PP II, Wen J (2009) Cryptic Dioecy in Nyssa yunnanensis (Nyssaceae), a Critically Endangered Species from Tropical Eastern Asia. Annals of the Missouri Botanical Garden 96(4): 672–684. https://doi.org/10.3417/2008015
- Tardella FM, Postiglione N, Vitanzi A, Catorci A (2017) The effects of environmental features and overstory composition on the understory species assemblage in sub-Mediterranean coppiced woods: Implications for a sustainable forest management. Polish Journal of Ecology 65(2): 167–182. https://doi.org/10.3161/15052249PJE2017.65.2.001
- Tateno R, Takeda H (2003) Forest structure and tree species distribution in relation to topography-mediated heterogeneity of soil nitrogen and light at the forest floor. Ecological Research 18(5): 559–571. https://doi.org/10.1046/j.1440-1703.2003.00578.x
- Thrippleton T, Bugmann H, Folini M, Snell RS (2018) Overstorey-Understorey Interactions Intensify After Drought-Induced Forest Die-Off: Long-Term Effects for Forest Structure and Composition. Ecosystems 21(4): 723–739. https://doi.org/10.1007/s10021-017-0181-5
- Trejo I, Dirzo R (2002) Floristic diversity of Mexican seasonally dry tropical forests. Biodiversity and Conservation 11(11): 2063–2048. https://doi.org/10.1023/A:1020876316013
- Trichon V (1997) Spatial heterogeneity of a tropical rain forest in Sumatra: Effect of topography on floristic structure. Annales des Sciences Forestieres 54: 431–446. https://doi.org/10.1051/forest:19970502
- Tsai HC, Chiang JM, McEwan RW, Lin TC (2018) Decadal effects of thinning on understory light environments and plant community structure in a subtropical forest. Ecosphere 9(10): e02464. https://doi.org/10.1002/ecs2.2464
- Tuomisto H, Ruokolainen K, Yli-Halla M (2003) Dispersal, Environment, and Floristic Variation of Western Amazonian Forests. Science 299(5604): 241–244. https://doi.org/10.1126/science.1078037
- Turner IM, Chua KS, Ong JSY, Soong BC, Tan HTW (1996) A century of plant species loss from an isolated fragment of lowland tropical rain forest. Conservation Biology 10(4): 1229–1244. https://doi.org/10.1046/j.1523-1739.1996.10041229.x
- Uhl B, Wölfling M, Fiedler K (2021) Local, forest stand and landscape-scale correlates of plant communities in isolated coastal forest reserves. Plant Biosystems - An International Journal Dealing with all Aspects of Plant Biology 155: 457–469. https://doi.org/10.1080/11263504.2020.1762776
- van Andel T (2001) Floristic composition and diversity of mixed primary and secondary forests in northwest Guyana. Biodiversity and Conservation 10(10): 1645–1682. https://doi.org/10.1023/A:1012069717077
- Vieira DCM, Socolowski F, Takaki M (2010) Seed germination and seedling emergence of the invasive exotic species, Clausena excavata. Brazilian Journal of Biology 70(4): 1015–1020. https://doi.org/10.1590/S1519-69842010000500014
- Vivian-Smith G (1997) Microtopographic Heterogeneity and Floristic Diversity in Experimental Wetland Communities. Journal of Ecology 85(1): 71–82. https://doi.org/10.2307/2960628
- Wester L (1992) Origin and distribution of adventive alien flowering plants in Hawaii. In: Stone CP, Smith CW, Tunison JT (Eds) Alien plant invasions in native ecosystems of Hawaii: management and research. University of Hawaii Press, Honolulu, Hawaii, USA, 99–154.
- Wright SJ (2002) Plant diversity in tropical forests: A review of mechanisms of species coexistence. Oecologia 130(1): 1–14. https://doi.org/10.1007/s004420100809
- Yavitt JB, Harms KE, Garcia MN, Wright SJ, He F, Mirabello MJ (2009) Spatial heterogeneity of soil chemical properties in a lowland tropical moist forest, Panama. Australian Journal of Soil Research 47(7): 674–687. https://doi.org/10.1071/SR08258
- Yirdaw E, Starr M, Negash M, Yimer F (2015) Influence of topographic aspect on floristic diversity, structure and treeline of afromontane cloud forests in the Bale Mountains, Ethiopia. Journal of Forestry Research 26(4): 919–931. https://doi.org/10.1007/s11676-015-0155-4
- Yirdaw E, Monge AM, Austin D, Toure I (2019) Recovery of floristic diversity, composition and structure of regrowth forests on fallow lands: Implications for conservation and restoration of degraded forest lands in Laos. New Forests 50(6): 1007–1026. https://doi.org/10.1007/s11056-019-09711-2
- Zhang CS, Xie GD, Fan SH, Zhen L (2010) Variation in Vegetation Structure and Soil Properties, and the Relation Between Understory Plants and Environmental Variables Under Different Phyllostachys pubescens Forests in Southeastern China. Environmental Management 45(4): 779–792. https://doi.org/10.1007/s00267-010-9429-y
- Zhang H, Zhuang X, Chu LM (2013) Plant Recruitment in Early Development Stages on Rehabilitated Quarries in Hong Kong. Restoration Ecology 21(2): 166–173. https://doi.org/10.1111/j.1526-100X.2012.00906.x
- Zhang QW, Zhu SD, Jansen S, Cao KF (2021) Topography strongly affects drought stress and xylem embolism resistance in woody plants from a karst forest in Southwest China. Functional Ecology 35(3): 566–577. https://doi.org/10.1111/1365-2435.13731
- Zhu SD, Li RH, Song J, He PC, Liu H, Berninger F, Ye Q (2016) Different leaf cost-benefit strategies of ferns distributed in contrasting light habitats of sub-tropical forests. Annals of Botany 117(3): 497–506. https://doi.org/10.1093/aob/mcv179
Appendix 1

Communities’ dendrogram in Cat Ba National Park. The numbers 1, 2, 3 and 4 showed the order of forestry communities after hierarchical cluster analysis. 1, Saraca dives + Calamus tetradactylus community (SCt); 2, Sterculia lanceolata + Chloris barbata community (SCb); 3, Ficus superba + Acanthus ebracteatus community (FAae); 4, Clausena excavata + Desmos cochinchinensis community (CDc). The “Height” axis shows the clustering height value associated with the Ward clustering method. The text of each branch showed the acronym of sample plots. LLA, low land area; MSA, mid-slope area; ISA, isolated area.
Appendix 2
The information of representative species of the four communities. If not stated otherwise, photographs were taken by Van Vien Pham.
| Species information | Image |
|---|---|
| Species: Saraca dives |
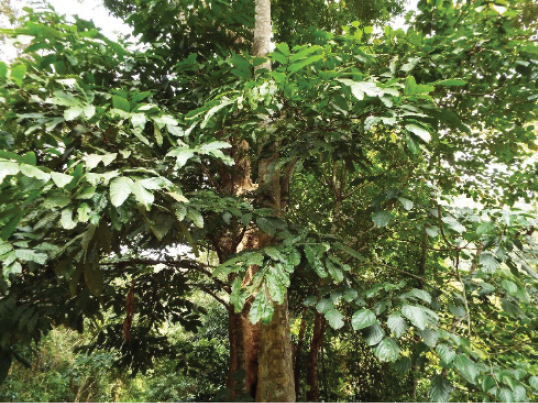
|
| Family: Fabaceae | |
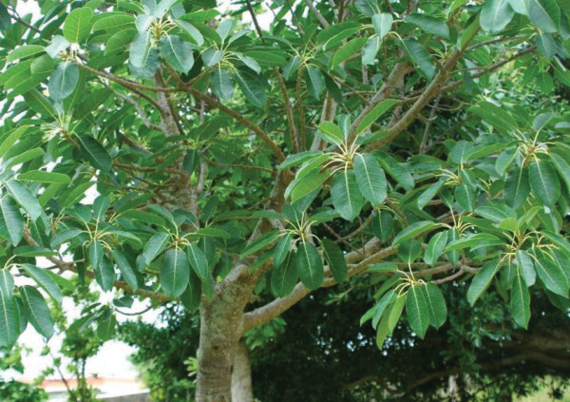
| Character: Small timber, tree height around 7–8 m. This species distributes near the stream, canals, water sources or humid areas, thick forests; distributed from north to central Vietnam. | |
| Species: Calamus tetradactylus |
|
| Family: Arecaceae | |
| Character: Vines, It grows in evergreen forest and scrub between 1 and 1000 m elevation and in Delta areas. This species has valuable in craft making and trade in Vietnam. | |
| Species: Sterculia lanceolata |
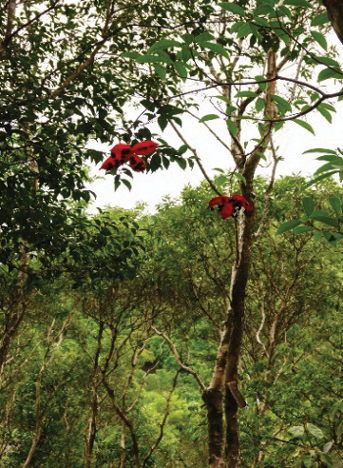
|
| Family: Sterculiaceae | |
| Character: Small timber tree, this species grows in mountainous areas, especially the hillsides in the midlands. The tree has large green leaves all year round and is suitable for moist areas. Flowers look like a star shape and in red. Distributed from Nnorth to central Vietnam. | |
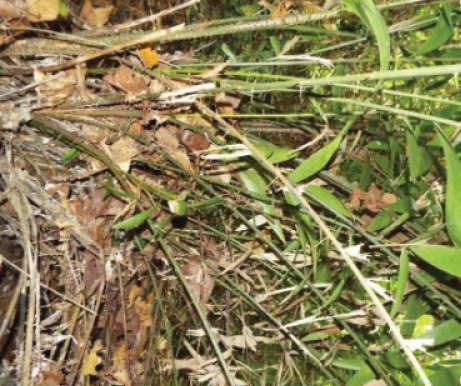
| Species: Chloris barbata |
|
| Family: Poaceae | |
| Character: Annual grass; distribution in dry places, especially coastal areas. | |
| Species: Ficus superba |
|
| Family: Moraceae | |
| Character: This species is a small to medium timber tree species, tree height is from 5–15 m. It grows favourably in rich nutrient soil, with good moisture and drainage, is also a drought-tolerant species, not fussy about cultivated soil. This species has a very strong regeneration. Its distribution is throughout Vietnam. | |
| Source: https://giahuygarden.vn | |
| Species: Acanthus ebracteatus |
|
| Family: Acanthaceae | |
| Character: Shrub trees with a height from 1–3 m. This species has a wide distribution; can be found in many habitats, such as in dense and open forests, coastal, valleys and swampy areas, water banks, estuarine areas and moist forests. | |
| Species: Clausena excavata |
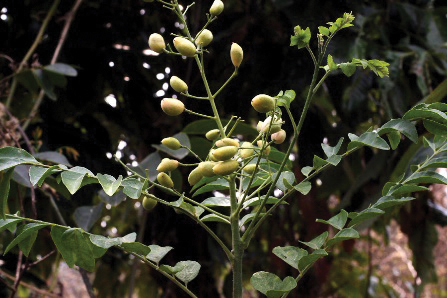
|
| Family: Rutaceae | |
| Character: Small timber tree. Tree height is around 5–6 m. It distributes from north to Ccentral Vietnam. | |
| Source: http://www.biotik.org/laos/species/c/claex/claex_03_en.html | |
| Species: Desmos cochinchinensis |
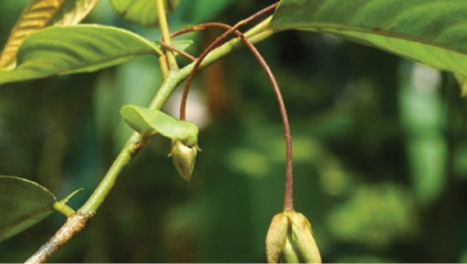
|
| Family: Annonaceae | |
| Character: Climber, branches whitish or rusty-red hairy, petals hairy, fruits red. It grows in stunted, poor forests. | |
| Source: https://www.ydhvn.com/public/news/cay-duoc-lieu-cay-gie-nam-bo-chap-chai-hoa-de-long-den-desmos-cochinchinensis-lour |
Appendix 3
The environmental and human activity characteristics in the three study sites (LLA, MSA and ISA) in Cat Ba National Park. The values represent the mean and standard deviation of 30 plots per study site (in total 90 plots). Small letters indicate significant differences at p ≤ 0.05 between the three areas. The “multicomp” package was used to calculate differences between the three study sites (
| Factors | Acronym | Average | LLA | MSA | ISA |
|---|---|---|---|---|---|
| Slope (°) | T_Sl | 17.23 ± 10.71 | 13.70 ± 9.67a | 19.02 ± 10.38b | 21.85 ± 10.62c |
| Rock surface (%) | T_RS | 44.49 ± 31.62 | 22.71 ± 23.02a | 56.71 ± 22.84b | 71.99 ± 23.07c |
| Elevation (m) | T_Ele | 75.33 ± 38.92 | 78.06 ± 37.02b | 66.57 ± 37.40a | 78.35 ± 42.30b |
| Soil depth (cm) | S_SD | 61.78 ± 38.77 | 75.89 ± 40.24b | 51.97 ± 31.25a | 45.67 ± 32.84a |
| Rock in soil (%) | S_SR | 9.59 ± 15.95 | 11.31 ± 19.83b | 10.75 ± 14.96b | 5.50 ± 3.77a |
| Soil moisture (%) | S_SM | 8.98 ± 5.72 | 5.98 ± 5.26a | 11.06 ± 4.40b | 12.41 ± 4.72c |
| Sand (%) | S_Sand | 31.45 ± 12.86 | 32.40 ± 11.26b | 24.75 ± 7.35a | 35.76 ± 16.55c |
| Silt (%) | S_Silt | 40.10 ± 8.18 | 41.95 ± 7.35b | 41.73 ± 5.48b | 35.37 ± 9.62a |
| Clay (%) | S_Clay | 28.45 ± 9.48 | 25.64 ± 10.47a | 33.52 ± 5.25c | 28.86 ± 8.61b |
| Soil humus content (%) | S_SH | 3.11 ± 1.49 | 2.67 ± 1.32a | 2.76 ± 1.24a | 4.20 ± 1.44b |
| pH | S_pH | 5.10 ± 0.56 | 4.79 ± 0.50a | 5.40 ± 0.53b | 5.39 ± 0.36b |
| Hydrolytic acidity (mmol /100 g) | S_HA | 5.01 ± 2.11 | 5.12 ± 1.98b | 4.58 ± 1.97a | 5.20 ± 2.38b |
| Cation exchange capacity (mmol / 100 g) | S_CEC | 6.92 ± 1.53 | 6.12 ± 1.43a | 7.33 ± 1.11b | 7.96 ± 1.22c |
| Base saturation (%) | S_BS | 58.88 ± 11.66 | 55.34 ± 12.09a | 62.78 ± 11.11b | 61.64 ± 9.31b |
| Indirect site factor | L_ISF | 9.17 ± 6.40 | 8.21 ± 2.75a | 10.37 ± 11.68b | 9.81 ± 3.39b |
| Footpaths | H_FP | 1.19 ± 0.45 | 1.25 ± 0.43b | 1.17 ± 0.57a | 1.11 ± 0.31a |
| Stumps | H_STP | 0.11 ± 0.31 | 0.21 ± 0.41b | 0.02 ± 0.15a | 0.00 ± 0.00a |
| Animal traps | H_AT | 0.65 ± 1.42 | 0.54 ± 1.16a | 0.33 ± 2.03b | 1.22 ± 0.95a |
Appendix 4

Classification tree of abiotic factors differentiating amongst communities. The regression tree shows independent environmental factors most closely related to the variation of communities. The communities were shown at the bottom of each branch of the independent environmental factors. The graph classifies environmental factors according to predictive strength (top to bottom). Abbreviations of the abiotic factors are defined in Table
Appendix 5
Estimated species pool of the CBNP. The estimation was based on all communities and for different combinations of communities. The value in the brackets represents the lower and upper confidence interval at 95%. SCt; Saraca dives + Calamus tetradactylus community. SCb; Sterculia lanceolata + Chloris barbata community. FAe; Ficus superba + Acanthus ebracteatus community. CDc; Clausena excavata + Desmos cochinchinensis community. The highest and lowest estimated values for the different community combinations are written in bold.
| Species richness | Shannon diversity | Simpson diversity | |
|---|---|---|---|
| (q = 0) | (q = 1) | (q = 2) | |
| Estimated species pool for all communities (SCt+SCb+FAe+CDc) | 367.7 | 159.8 | 105.4 |
| (339.3 ÷ 417.7) | (154.4 ÷ 165.2) | (102.9 ÷ 108.9) | |
| Combination of communities: | |||
| SCb+FAe+CDc | 358.4 | 149 | 97 |
| (318.1 ÷ 429.6) | (142.6 ÷ 155.5) | (94.2 ÷ 100.8) | |
| SCt+FAe+CDc | 334.7 | 147.9 | 97.5 |
| (300.8 ÷ 394.4) | (141 ÷ 154.8) | (94.2 ÷ 102.1) | |
| SCt+SCb+CDc | 354.7 | 160.1 | 106.4 |
| (324.4 ÷ 408.5) | (154.1 ÷ 166) | (103.4 ÷ 110.8) | |
| SCt+SCb+FAe | 377.9 | 166.6 | 109.7 |
| (343.1 ÷ 437.9) | (160.6 ÷ 172.6) | (106.3 ÷ 114.3) | |
| FAe+CDc | 244.3 | 106.8 | 71.4 |
| (209.3 ÷ 313.2) | (100.8 ÷ 112.8) | (68.8 ÷ 75.3) | |
| SCb+CDc | 338.6 | 151.1 | 99.9 |
| (296.9 ÷ 413.9) | (143.7 ÷ 158.5) | (96.2 ÷ 104.5) | |
| SCb+FAe | 357.1 | 160.7 | 104.7 |
| (313.6 ÷ 433.2) | (153.4 ÷ 168.1) | (100.3 ÷ 109.6) | |
| SCt+CDc | 328 | 147.9 | 97.7 |
| (283.9 ÷ 407.5) | (139.68 ÷ 156.2) | (93.2 ÷ 102.7) | |
| SCt+FAe | 327.5 | 158 | 104.6 |
| (289.4 ÷ 394.3) | (149.3 ÷ 166.7) | (99.16 ÷ 110) | |
| SCt+SCb | 356.4 | 161.5 | 106.8 |
| (319.6 ÷ 420.2) | (154.3 ÷ 168.7) | (103 ÷ 111.6) | |
Appendix 6

Species diversity patterns of the tree and non-tree species. The graphs show the Shannon (q = 1) and Simpson diversity (q = 2) (Hill number) from iNEXT analysis. The red colour represented the total tree species of all four communities (gamma diversity). Yellow-green colour represented the Saraca dives + Calamus tetradactylus community (SCt). The green colour represented the Sterculia lanceolata + Chloris barbata community (SCb). Light-blue represented Ficus superba + Acanthus ebracteatus community (FAe) and pink colour represented Clausena excavata + Desmos cochinchinensis community (CDc). The fade of the line showed the confidence level at 95%.
Appendix 7

Linear models of non-tree species and threatened tree species abundance. Graphs (a) and (c) show the relationship between non-tree species and threatened tree species abundance across communities. Graphs (b) and (d) present the relationship of non-tree species to threatened tree species abundance separated by the four communities. All relationships are not significant as indicated by the dashed lines. SCt; Saraca dives + Calamus tetradactylus community. SCb; Sterculia lanceolata + Chloris barbata community. FAe; Ficus superba + Acanthus ebracteatus community. CDc; Clausena excavata + Desmos cochinchinensis community.
Appendix 8
Species checklist. This table contains the 302 species which were recorded in the CBNP in course of this study. It includes 153 tree species (comprising the overstorey layer and the regeneration layer) and 149 non-tree species. The classification is provided as well.
| No | Species name | Family | Indigenous name | Classification |
|---|---|---|---|---|
| 1 | Acacia lucium (Benth). I: Nielsen | Mimosaceae | Mán đỉa trâu | Tree |
| 2 | Acanthus ebracteatus Vahl. | Acanthaceae | Ô rô | Non-tree |
| 3 | Achyranthes aspera L. | Amaranthaceae | Cỏ xước | Non-tree |
| 4 | Acronychia pedunculata L. | Rutaceae | Bưởi bung | Tree |
| 5 | Actinodaphne pilosa (Lour.) Merr. | Lauraceae | Tam tầng | Non-tree |
| 6 | Adenanthera pavonica L. | Mimosaceae | Muồng ràng ràng | Tree |
| 7 | Aesculus assamica Griff. | Hippocastanaceae | Kẹn | Non-tree |
| 8 | Aglaia poilanei Pell. | Meliaceae | Ngâu dại | Non-tree |
| 9 | Aglaia spectabilis (Miq.) Jain& Bennet. 1987 | Meliaceae | Gội nếp | Tree |
| 10 | Aidia pycnantha (Drake) Tirveng | Rubiaceae | Mãi táp | Tree |
| 11 | Albizia chinensis (Osbeek) Merr | Fabaceae | Đuôi trâu | Tree |
| 12 | Allophylus livescens Radlk. | Sapindaceae | Vải đóm | Non-tree |
| 13 | Allospondias lakonensis (Pierre) Stapf | Anacardiaceae | Dâu da xoan | Tree |
| 14 | Alpinia officinarum Hance | Zingiberaceae | Riềng ré | Non-tree |
| 15 | Alstonia scholaris (L.) R.Br. | Apocynaceae | Sữa | Tree |
| 16 | Amomum xanthioides Wall. ex Baker | Zingiberaceae | Sa nhân núi | Non-tree |
| 17 | Amorphophalus tonkinensis Engl. & Gehrm. | Araceae | Nưa bắc bộ | Non-tree |
| 18 | Angiopteris evecta (J.R. Forst.) Hoffm. | Angiopteridaceae | Quan âm tọa liên | Non-tree |
| 19 | Annamocarya sinensis (Dode) J. Leroy | Juglandaceae | Chò đãi | Tree |
| 20 | Annona glabra L. | Annonaceae | Na biển | Tree |
| 21 | Antidesma ambiguum Pax et Hoffm. | Euphorbiaceae | Chòi mòi | Non-tree |
| 22 | Aphanamixis polystachya (Wall.) R. Parke | Meliaceae | Gội gác | Tree |
| 23 | Aporosa macrostachyus (Tul.) Muell.Arg. | Euphorbiaceae | Tai nghé đuôi to | Tree |
| 24 | Aporusa ficifolia H. Baillon | Euphorbiaceae | Tai nghé | Tree |
| 25 | Aralia aff. chinensis L. | Araliaceae | Quầng quầng | Non-tree |
| 26 | Archidendron clypearia | Fabaceae | Mán đỉa | Tree |
| 27 | Ardisia crenata Sims | Primulaceae | Trọng đũa | Non-tree |
| 28 | Ardisia gigantifolia Stapf | Primulaceae | Lá khôi trắng | Non-tree |
| 29 | Ardisia nigropilosa Pit. | Primulaceae | Trọng đũa lông đen | Non-tree |
| 30 | Ardisia silvestris Pitard. | Myrsinaceae | Lá khôi tía | Non-tree |
| 31 | Arenga westerhoutii Griffith | Arecaceae | Búng báng | Non-tree |
| 32 | Artocarpus borneensis Merr. Subsp. Griffthii (Kurz) Jarr. | Moraceae | Troi | Tree |
| 33 | Asplenium nidus (L.) J.Sm. | Aspleniaceae | Tổ điểu | Non-tree |
| 34 | Atalantia guillauminii Sw. | Rutaceae | Quýt hôi | Tree |
| 35 | Averrhea carambola L. | Oxalidaceae | Khế | Tree |
| 36 | Bambusa blumeana J. A. & J. H. Schultes | Poaceae | Tre gai | Non-tree |
| 37 | Bambusa chungii McClure | Poaceae | Dùng phấn | Non-tree |
| 38 | Barringtonia acutangula (L.) Gaertn. | Lecythidaceae | Lộc vừng lá to | Tree |
| 39 | Bauhinia coccinea (Lour.) A. DC. | Caesalpiniaceae | Móng bò hoa đỏ | Non-tree |
| 40 | Bauhinia khasiana var. polystachya (Gagnep.) K.&S.S.Larsen | Caesalpiniaceae | Dây quạch tròn | Non-tree |
| 41 | Bauhinia lakhonensis Gagnep | Caesalpiniaceae | Dây quạch dẹt | Non-tree |
| 42 | Bauhinia ornata Kurz | Caesalpiniaceae | Dây móng bò thơm | Non-tree |
| 43 | Begonia aff. wallichinia A. DC. | Begoniaceae | Thu hải đường vát | Non-tree |
| 44 | Bischofia javanica Blume (B. trifoliata (Roxb.) Hook. f.) | Euphorbiaceae | Nhội tiết | Tree |
| 45 | Blechnum orientale L. | Blechnaceae | Quyết lá dừa | Non-tree |
| 46 | Blumea lacineata (Roxb.) DC. | Asteraceae | Dẻ rách | Non-tree |
| 47 | Boehmeria holoseracea Blume | Urticaceae | Gai rừng | Non-tree |
| 48 | Boehmeria nivea (L) Gaud | Urticaceae | Lá gai | Non-tree |
| 49 | Bombax malabarica DC. | Bombacaceae | Gạo rừng | Tree |
| 50 | Breynia fruticosa (L.) Hook. f. | Euphorbiaceae | Bồ cu vẽ | Non-tree |
| 51 | Bridelia balansae Tutcher | Euphorbiaceae | Đỏm gai | Tree |
| 52 | Bridelia tomntosa Blume | Euphorbiaceae | Đỏm lông | Tree |
| 53 | Burretiodendron brilletii (Gagn.) Kost. | Tiliaceae | Kiêng quang | Tree |
| 54 | Bursera tonkinensis Guillaum | Burseraceae | Rẫm | Tree |
| 55 | Caesalpinia bonduc (L.) Roxb. | Caesalpiniaceae | Dây móc mèo | Non-tree |
| 56 | Calamus platyacanthus Warb. Ex Becc. | Arecaceae | Song mật | Non-tree |
| 57 | Calamus tetradactylus Hance | Arecaceae | Mây | Non-tree |
| 58 | Callicarpa triloba Lour. | Vitaceae | Chìa vôi | Non-tree |
| 59 | Canarium album | Burseraceae | Trám trắng | Tree |
| 60 | Canarium subulatum Guill | Burseraceae | Trám ba cạnh | Tree |
| 61 | Canarium tramdenum Dai &Yakovl | Burseraceae | Trám đen | Tree |
| 62 | Canthium dicoccum (Gaertn.) Teysm. & Binn | Rubiaceae | Xương cá | Tree |
| 63 | Carallia brachiata (Lour.) Merr. | Rhizophoraceae | Trúc tiết | Tree |
| 64 | Carallia diplopetala | Rhizophoraceae | Răng cá | Tree |
| 65 | Caryota obtusa Griff. | Arecaceae | Đùng đình | Non-tree |
| 66 | Caryota urens L. | Palmeae | Móc | Non-tree |
| 67 | Cassia timoriensis A. DC. | Caesalpiniaceae | Muồng cánh dán | Tree |
| 68 | Castanopsis chinensis (Spreng.) Hance. | Fagaceae | Dẻ gai | Tree |
| 69 | Castanopsis ferox (Roxb.) Spach | Fagaceae | Cà ổi vọng phu | Tree |
| 70 | Celastrus hindsii Benth. & Hook. | Celastraceae | Xạ vàng | Non-tree |
| 71 | Celastrus sp. | Celastraceae | Xạ đen | Non-tree |
| 72 | Centella asiatica (L.) Urb. | Apiaceae | Ráu má | Non-tree |
| 73 | Chisocheton paniculatus Hiern | Meliaceae | Quếch tía | Tree |
| 74 | Chloris barbata Sw. | Poaceae | Cỏ mật | Non-tree |
| 75 | Chromolaena odorata (L.) King et Robinson | Asteraceae | Cỏ lào | Non-tree |
| 76 | Chukrasia tabularis A. Juss. | Meliaceae | Lát hoa | Tree |
| 77 | Cinnamomum ovantum Allen. | Lauraceae | Rè gừng | Tree |
| 78 | Cissus subtetragona Blume | Vitaceae | Hồ đằng vuông | Non-tree |
| 79 | Citrus aurantiifolia (Chritm.) Sw. | Rutaceae | Chanh rừng | Non-tree |
| 80 | Claoxylon indicum (Reinw.ex Blume) | Euphorbiaceae | Lộc mại | Tree |
| 81 | Clausena excavata Burm.f. | Rutaceae | Hồng bì rừng | Tree |
| 82 | Cleistanthus myrianthus (Hassk.) Kurz | Euphorbiaceae | Cọc rào | Non-tree |
| 83 | Clerodendrum chinense (Osk.) Mabb. | Fagaceae | Ngọc nữ thơm | Non-tree |
| 84 | Clerodendrum squamatum Vahl | Verbenaceae | Xích đồng nam | Non-tree |
| 85 | Cnestis palala (Lour.) Merr. | Connaraceae | Dây khế | Non-tree |
| 86 | Colocaria gigantea (Blume ex Hassk) Hook.f. | Araceae | Ráy | Non-tree |
| 87 | Commelina communis L. | Commelinaceae | Thài lài | Non-tree |
| 88 | Connarus paniculatus Roxb. | Connaraceae | Dây mấu | Non-tree |
| 89 | Convolvulus parviflorus Vohl. | Convolvulaceae | Bìm bìm | Non-tree |
| 90 | Cordyline fruticosa (L.) Goepp. | Asteliaceae | Huyết dụ | Non-tree |
| 91 | Cratoxylon formosum subsp.prunifolium (Kurz) Gog. | Guttiferae | Đỏ ngọn | Tree |
| 92 | Cratoxylum cochinchinense (Lour.) Blume | Hypericaceae | Thành ngạnh | Tree |
| 93 | Croton cubiensis Gagn. | Euphorbiaceae | Cù đèn | Non-tree |
| 94 | Cryptocarya lenticellata Lecomte | Lauraceae | Nanh chuột | Tree |
| 95 | Curculigo gracilis (Kurz) Wall. | Hypoxidaceae | Sâm cau | Non-tree |
| 96 | Cyclosorus parasiticus (L.) Farw. | Thelypteridaceae | Dương xỉ | Non-tree |
| 97 | Cymbidium hybrid | Orchidaceae | Địa lan | Non-tree |
| 98 | Cymbodium alviclium sw. | Orchidaceae | Lan kiếm | Non-tree |
| 99 | Desmos cochinchinensis Lour. | Annonaceae | Dây hoa dẻ | Non-tree |
| 100 | Deutzianthus tonkinensis Gagnep | Euphorbiaceae | Mọ | Tree |
| 101 | Dianella ensifolia (L.) DC. | Phormiaceae | Hương bài | Non-tree |
| 102 | Dichroa febrifuga Lour. | Hydrangeaceae | Thường sơn | Non-tree |
| 103 | Dillenia heterosepala Fin&Gagnep | Dilleniaceae | Lọng bàng | Tree |
| 104 | Dillenia indica L. | Dilleniaceae | Sổ bà | Tree |
| 105 | Dillenia scabrella Roxb | Dilleniaceae | Sổ nước | Tree |
| 106 | Dimocarpus fumatus subsp. indochinensis Leenh | Sapindaceae | Nhãn rừng | Tree |
| 107 | Dioscorea alata L | Dioscoreaceae | Củ mỡ | Non-tree |
| 108 | Dioscorea persimilis Prain et Burk. | Dioscoreaceae | Củ mài | Non-tree |
| 109 | Diospyros decandra Lour | Ebenaceae | Nhọ nồi | Tree |
| 110 | Diospyros petelotii Merr. | Ebenaceae | Thị mấm | Tree |
| 111 | Diospyros pilosula (A. DC.) Hiern | Ebenaceae | Thị rừng | Tree |
| 112 | Diospyros susarticulata Lec, | Ebenaceae | Thị đốt cao | Tree |
| 113 | Donella lanceolata (Bl.) Aubr. | Sapotaceae | Sạp đỏ | Non-tree |
| 114 | Dracaena sanderiana forma virescens Hort. | Dracaenaceae | Sống đời | Non-tree |
| 115 | Dracontomelon duperreanum Piere | Anacardiaceae | Sấu | Tree |
| 116 | Drimycarpus racemosus Hook. | Anacardiaceae | Sơn xã | Tree |
| 117 | Drynaria fortunei (Merr.) J.Sm. | Polypodiaceae | Bổ cốt toái | Non-tree |
| 118 | Duabanga grandiflora (DC.) Walp. | Sonneratiaceae | Phay sừng | Tree |
| 119 | Elaeagnus bonii Lecomte | Elaeagnaceae | Nhót rừng | Non-tree |
| 120 | Elaeocarpus griffithii (Wight) A. Gray | Elaeocarpaceae | Côm tầng | Tree |
| 121 | Elephantopus mollis H.B.K. | Asteraceae | Chân voi | Non-tree |
| 122 | Eleusine indica (L.) Gaertn. | Poaceae | Cỏ mần trầu | Non-tree |
| 123 | Embelia laeta (L.) Mez. | Myrsinaceae | Rè vũ | Non-tree |
| 124 | Endospermum chinense Benth. | Euphorbiaceae | Vạng trứng | Tree |
| 125 | Engelhardtia roxburghiana Wall | Juglandaceae | Chẹo tía | Tree |
| 126 | Entada glandulosa Pierre ex Gagn. | Mimosoideae | Bàm bàm tuyến | Non-tree |
| 127 | Eriobotrya bengalensis (Roxb.) Hook.f. | Rosaceae | Tỳ bà rừng | Tree |
| 128 | Erythrophleum fordii Oliv. | Caesalpiniaceae | Lim xanh | Tree |
| 129 | Euodia lepta (Spreng) Merr. | Rutaceae | Chè đắng | Tree |
| 130 | Eurya ciliata Merr. | Theaceae | Súm lông | Tree |
| 131 | Eurycoma longifolia Jack. | Simaroubaceae | Bền bệt | Non-tree |
| 132 | Excoecaria cochinchinensis var. viridis (Pax & Hoffm.)Merr. | Euphorbiaceae | Sơn đề | Non-tree |
| 133 | Ficus alongensis Gagnep | Moraceae | Sung hạ long | Tree |
| 134 | Ficus altissima Blume | Moraceae | Đa trâu | Tree |
| 135 | Ficus annulata Blume | Moraceae | Đa nhộng vàng | Tree |
| 136 | Ficus auriculata Lour. | Moraceae | Vả | Tree |
| 137 | Ficus capillipes Gagn. | Moraceae | Đa cuống bẹt | Tree |
| 138 | Ficus chlorocarpa Benth. | Moraceae | Sung rừng | Tree |
| 139 | Ficus hirta Vahl | Moraceae | Vú bò | Non-tree |
| 140 | Ficus hispida L.f. | Moraceae | Ngái | Tree |
| 141 | Ficus retusa L. | Moraceae | Si | Tree |
| 142 | Ficus rumphii Bl. | Moraceae | Da bò | Tree |
| 143 | Ficus superba var.japonica Miq. | Moraceae | Sộp | Tree |
| 144 | Garcinia cochinchinesis (Lour.) Choisy | Clusiaceae | Bứa tai chua | Tree |
| 145 | Garcinia cowa Roxb. ex DC. | Clusiaceae | Tai chua | Tree |
| 146 | Garcinia oblongifolia Champ. | Clusiaceae | Bứa | Tree |
| 147 | Garcinia tinctoria (DC.) W. Wight | Clusiaceae | Bứa cơm | Tree |
| 148 | Garruga pinnata Roxb. | Burseraceae | Trám mao | Tree |
| 149 | Gelsemium elegans | Gelsemiaceae | Dây lá ngón | Non-tree |
| 150 | Gigantochloa albo-ciliata (Munro) Kurz | Poaceae | Le | Non-tree |
| 151 | Gironniera subequalis Planch. | Ulmaceae | Ngát | Tree |
| 152 | Gleichenia linearis Clarke | Gleicheniaceae | Ràng ràng | Non-tree |
| 153 | Glochidion hirsutum (Roxb.) Voigt | Euphorbiaceae | Bọt ếch biển | Tree |
| 154 | Glycosmis cymosa (Pierre) Stone | Rutaceae | Màu cau đá | Tree |
| 155 | Gnetum montanum | Gnetaceae | Dây gắm | Non-tree |
| 156 | Gomphandra tonkinensis Gapnep | Icacinaceae | Bổ béo | Non-tree |
| 157 | Goniothalamus macrocalyx Ban | Annonaceae | Màu cau trắng | Tree |
| 158 | Gynostemma pentaphyllum | Cucurbitaceae | Giảo cổ lam | Non-tree |
| 159 | Helicteres angustifolia L. | Sterculiaceae | Tổ kén tròn | Non-tree |
| 160 | Helicteres hirsuta Lour | Malvaceae | Thao kén cái | Non-tree |
| 161 | Helixanthera parasitica Lour. | Loranthaceae | Tầm gửi ký sinh | Non-tree |
| 162 | Heterosmilax gaudichaudiana (Kunth.) Maxim | Smilacaceae | Khúc khắc | Non-tree |
| 163 | Hydnocarpus hainanensis (Merr.) Sleum. | Flacourtiaceae | Nang trứng hải nam | Tree |
| 164 | Iodes cirrhosa Turez | Icacinaceae | Mộc thông | Non-tree |
| 165 | Ixora umbellata Vahl | Rubiaceae | Đơn ớt | Non-tree |
| 166 | Jasminum subtriplinerve | Oleaceae | Chè vằng | Non-tree |
| 167 | Knenma conferta Warb. | Myristicaceae | Máu chó | Tree |
| 168 | Lagerstroemia calyculata Kurz | Lythraceae | Săng lẻ | Tree |
| 169 | Lemmaphyllum microphyllum Presl. | Polypodiaceae | Tắc kè đá | Non-tree |
| 170 | Lilium brownii F.E Brown var colchesteri Wilson | Liliaceae | Tỏi rừng | Non-tree |
| 171 | Liquidambar formosana Hance | Hamamelidaceae | Sau sau | Tree |
| 172 | Lithocarpus fissus Champ. ex benth | Fabaceae | Sồi phảng | Tree |
| 173 | Lithocarpus hemisphaericus (Drake) Barnett | Fagaceae | Trâm dày | Tree |
| 174 | Litsea monopetala (Roxb.) Pers. | Lauraceae | Mò giấy | Tree |
| 175 | Litsea verticillata Hance | Lauraceae | Bời lời vòng | Tree |
| 176 | Livistona halongensis T.H. Nguyen & Kiew | Arecaceae | Cọ hạ long | Tree |
| 177 | Lonicera japonica Thunb. | Caprifoliaceae | Kim ngân | Non-tree |
| 178 | Lycopodiella cernua (L.) Franco & Vasc. | Arecaceae | Thông đất | Non-tree |
| 179 | Lygodium japonicum Sw | Lygodiaceae | Bòng bong | Non-tree |
| 180 | Macaranga denticulata (Blume) Muell. Arg. | Euphorbiaceae | Lá nến | Tree |
| 181 | Machilus bonii Lecomte | Lauraceae | Kháo vàng | Tree |
| 182 | Machilus salicina Hance | Lauraceae | Kháo lá liễu | Tree |
| 183 | Machilus thunbergii Sieb. & Zucc. | Lauraceae | Rè thunberg | Tree |
| 184 | Machilus velutina Champ. ex Benth. | Lauraceae | Kháo lông | Tree |
| 185 | Maclura cochinchinensis (Lour.) | Moraceae | Mỏ quạ | Non-tree |
| 186 | Maesa balansae Mez. | Myrsinaceae | Đơn nem | Non-tree |
| 187 | Maesa montana A.DC. | Myrsinaceae | Đơn độc trắng | Non-tree |
| 188 | Maesa ramentacea Wall. | Myrsinaceae | Đơn độc đỏ | Non-tree |
| 189 | Magnolia balansae | Magnoliaceae | Giổi bà | Tree |
| 190 | Malaisia scandens (Lour.) Pl. | Moraceae | Duối leo | Non-tree |
| 191 | Mallotus apelta (Lour.) Muell.-Arg. | Euphorbiaceae | Ba bét trắng | Non-tree |
| 192 | Mallotus cochinchinensis Lour. | Euphorbiaceae | Ba soi | Tree |
| 193 | Mallotus philippensis (Lamk.) Muell.-Arg. | Euphorbiaceae | Cánh kiến | Non-tree |
| 194 | Mangifera longipes Griff. | Anacardiaceae | Trôi | Tree |
| 195 | Manglietia rufibarbata Dandy | Magnoliaceae | Giổi xanh | Tree |
| 196 | Markhamia cauda-felina (Hance) Craib. | Bignoniaceae | Kè đuôi nhông | Tree |
| 197 | Melaleuca cajuputi Powell | Myrtaceae | Tràm nước | Tree |
| 198 | Melodinus annamensis Pit. | Apocynaceae | Dây rom sữa | Non-tree |
| 199 | Memecylon edule Roxb. | Melastomataceae | Sầm sì | Tree |
| 200 | Mesua ferrea L. | Clusiaceae | Vắp | Tree |
| 201 | Microcos paniculata Miq | Tiliaceae | Mé cò ke | Tree |
| 202 | Microsorum hancockii (Bak.) Ching. | Polypodiaceae | Lá han | Non-tree |
| 203 | Millettia pulchra Kunz | Fabaceae | Nam bạch chỉ | Non-tree |
| 204 | Millettia sp | Papilionoideae | Kè | Tree |
| 205 | Morinda citrifolia L.var.bracteata Hook.f. | Rubiaceae | Nhàu | Tree |
| 206 | Murraya glabra (Guillaum.) | Rutaceae | Vương tùng | Tree |
| 207 | Musa paradisiaca L. | Musaceae | Chuối rừng | Non-tree |
| 208 | Mussaenda crosa Champ. ex Benth. | Rubiaceae | Bướm bạc môn | Non-tree |
| 209 | Mussaenda pilosissima Val. | Rubiaceae | Dây bướm lông | Non-tree |
| 210 | Nervilia fordii (Hance) Sch. | Orchidaceae | Lan một lá | Non-tree |
| 211 | Paliorus tonkinensis Pit. | Rhamnaceae | Táo dáng | Tree |
| 212 | Pandanus tectorius Sol ex Park. | Pandanaceae | Dứa dại | Non-tree |
| 213 | Paramichelia baillonii (Pierre) Hu | Magnoliaceae | Giổi găng | Tree |
| 214 | Pavetta indica L. | Rubiaceae | Cẳng gà | Tree |
| 215 | Peltophorum pterocarpum | Caesalpiniaceae | Lim xẹt | Tree |
| 216 | Persea balansae Airy-Shaw | Lauraceae | Kháo lá to | Tree |
| 217 | Persea mollis (W.W.Sm.) Kost. | Lauraceae | Kháo tai trâu | Tree |
| 218 | Pheobe tavoyana Meisn. | Lauraceae | Sụ lá to | Tree |
| 219 | Phoebe pallida Nees. | Lauraceae | Kháo nước | Tree |
| 220 | Phrynium placentarium (Lour.) Merr. | Maranthaceae | Lá dong | Non-tree |
| 221 | Phyllanthus reticulatus Poir. | Euphorbiaceae | Phèn đen | Non-tree |
| 222 | Phytele phantoideae | Arecaceae | Xuôi | Non-tree |
| 223 | Piper chaudocanum C. DC | Piperaceae | Trầu rừng | Non-tree |
| 224 | Piper lolot C. DC. | Piperaceae | Lá lốt | Non-tree |
| 225 | Podocarpus fleuryi Hickel | Podocarpaceae | Kim giao | Tree |
| 226 | Portulaca oleacea L. | Portulacaceae | Sam núi đá | Non-tree |
| 227 | Psychotria montana Blume | Rubiaceae | Lấu | Non-tree |
| 228 | Pteris vittata L. | Pteridaceae | Chân rết | Non-tree |
| 229 | Pterospermum diversifolium | Sterculiaceae | Lòng mang lá đa dạng | Tree |
| 230 | Pterospermum heterophyllum Hance | Sterculiaceae | Lòng mang xanh | Tree |
| 231 | Pterospermum truncatolobatum Gagn. | Sterculiaceae | Lòng mang cụt | Tree |
| 232 | Quercus platycalyx Hickel & A. Camus | Fabaceae | Sồi đĩa | Tree |
| 233 | Quisqulis indica L. | Combretaceae | Dây dầu giun | Non-tree |
| 234 | Randia dasycarpa (Kurz) Bakh. f | Rubiaceae | Găng nhung | Non-tree |
| 235 | Rauvolfia cambodiana Pierre ex Pit. | Apocynaceae | Ba gạc | Non-tree |
| 236 | Rauvolfia verticillata (Lour.) Baill. | Apocynaceae | Ba gạc vòng | Non-tree |
| 237 | Rhapis micrantha Becc | Arecaceae | Lụi | Non-tree |
| 238 | Rhizophora apiculata Bl. | Rhizophoraceae | Đước đôi | Tree |
| 239 | Rhodoleia championii Hook. | Hamamelidaceae | Hồng quang | Non-tree |
| 240 | Rhus chinensis Muell. | Anacardiaceae | Dâu dắt | Tree |
| 241 | Rinorea bengalensis (Wall.) Kuntze | Violaceae | Ngát giả | Tree |
| 242 | Sapium discolor (Champ. ex Benth.) Muell.-Arg. | Euphorbiaceae | Sòi tía | Tree |
| 243 | Saraca dives | Fabaceae | Vàng anh | Tree |
| 244 | Sargentodoxa cuneata (Oliv.) Rehd. et Wiis. | Sargeniodoxceae | Huyết đằng | Non-tree |
| 245 | Sauropus androgynus (L.) Merr | Euphorbiaceae | Rau ngót rừng | Non-tree |
| 246 | Sauropus macranthus Hassk. | Euphorbiaceae | Vỏ rộp | Non-tree |
| 247 | Schefflera alongensis R.Vig. | Araliaceae | Chân chim hạ long | Non-tree |
| 248 | Schefflera heptaphylla (L.) Frodin | Araliaceae | Chân chim tám lá | Non-tree |
| 249 | Schizostachyum dulloa | Poaceae | Nứa tép | Non-tree |
| 250 | Secamone elliptica R.Br. | Asclepiadaceae | Ro bầu dục | Non-tree |
| 251 | Selaginella decipiens Warb. | Selaginellaceae | Quyển bá | Non-tree |
| 252 | Selaginella delicatula (Desv.) Alst. | Selaginellaceae | Quyển bá mỏng | Non-tree |
| 253 | Sindora tonkinensis A. Chev. ex K. S. Larsen | Caesalpiniaceae | Gụ lau | Tree |
| 254 | Sinosideroxylon racemosum (Dub.) Aubr. | Sapotaceae | Mai lai | Tree |
| 255 | Sloanea sp. | Elaeocarpaceae | Côm nhím | Tree |
| 256 | sp. 1 | Moraceae | Đèo heo | Tree |
| 257 | sp. 2 | Euphorbiaceae | Mấy | Tree |
| 258 | sp. 3 | Rubiaceae | Đèn en | Tree |
| 259 | sp. 4 | sp4 | Áng nước | Tree |
| 260 | sp. 5 | sp5 | Vấp | Tree |
| 261 | Spilanthes paniculata Wall. ex DC | Asteraceae | Cây cúc áo | Non-tree |
| 262 | Sporobolus fertilis (Steud.) Calayton | Poaceae | Cỏ lông công | Non-tree |
| 263 | Stephania rotunda Lour. | Menispermaceae | Bình vôi | Non-tree |
| 264 | Sterculia foetida L. | Sterculiaceae | Mần lái | Tree |
| 265 | Sterculia lanceolata Cav. | Sterculiaceae | Sảng nhung | Tree |
| 266 | Streblus asper Lour. | Moraceae | Ruối nhám | Non-tree |
| 267 | Streblus laxiflos (Hutch.) Corner | Moraceae | Duối rừng | Tree |
| 268 | Streblus macrophyllus Bl. | Moraceae | Mạy tèo | Tree |
| 269 | Streblus tonkinensis (Dub. & Eberh.) Corner | Moraceae | Teo nông | Tree |
| 270 | Strychnos angustiflora Benth. | Loganiacaea | Củ chấy | Non-tree |
| 271 | Strychnos wallichii Steud. = S. gaulthierana Pierre | Loganiacaea | Mã tiền dây | Non-tree |
| 272 | Swietenia macrophylla | Meliaceae | Dái ngựa | Tree |
| 273 | Symplocos laurina var. acuminata (Miq) Brand. | Symplocaceae | Dung giấy | Tree |
| 274 | Syzygium bullockii (Hance) Merr. et Perry | Myrtaceae | Trâm voi | Tree |
| 275 | Syzygium jambos (L.) Alston | Myrtaceae | Roi rừng | Tree |
| 276 | Syzygium pachysarcum (Gagn.) Merr. & Perry. | Myrtaceae | Trâm sánh | Tree |
| 277 | Syzygium wightianum Wight et Arn. | Myrtaceae | Trâm trắng | Tree |
| 278 | Syzygium zeylanicum (L.) DC. | Myrtaceae | Trâm vỏ đỏ | Tree |
| 279 | Syzysium senamangense (Bl.) Merr. & Perry. | Myrtaceae | Mận rừng | Tree |
| 280 | Taractogenos sp | Flacourtiaceae | Chùm bao | Tree |
| 281 | Taxillus chinensis (DC.) Dans. | Loranthaceae | Hồng tuyến | Non-tree |
| 282 | Tetracera scandens (L.) Merr | Dilleniaceae | Dây chặc chìu | Non-tree |
| 283 | Tetrastigma retinervum Planch. | Vitaceae | Dây doãn | Non-tree |
| 284 | Thunbergia eberhardtii R.Ben. | Acanthaceae | Cát đằng vàng | Non-tree |
| 285 | Tinospora sagitta (Oliv.) Gagnep | Menispermaceae | Củ gió | Non-tree |
| 286 | Tinospora sinensis (Lour.) Merr. | Menispermaceae | Đơn xương | Non-tree |
| 287 | Triumfetta bartramia L. | Tiliaceae | Ké | Non-tree |
| 288 | Tsoongiodendron odorum Chun | Magnoliaceae | Giổi lụa | Tree |
| 289 | Uvaria microcarpa Champ. ex Benth. | Annonaceae | Dất lông | Non-tree |
| 290 | Ventilago leiocarpa Benth. | Rhamnaceae | Dây cốt khí | Non-tree |
| 291 | Verbesina biflora L | Asteraceae | Lá mui biển | Non-tree |
| 292 | Vernonia aff. acumingiana Benth. | Asteraceae | Thuốc máu | Non-tree |
| 293 | Vitis balanseana Blume | Vitaceae | Đậu xương | Non-tree |
| 294 | Vittaria ensiformis Sw. | Thelypteridaceae | Quyết dương xỉ | Non-tree |
| 295 | Wendlandia paniculata (Roxb.) DC. | Rubiaceae | Hoắc quang trắng | Tree |
| 296 | Wrightia tomentosa (Roxb.) Roem. & Schult. | Apocynaceae | Thừng mực | Tree |
| 297 | Wrightia laevis Hook.f. | Apocynaceae | Thừng mực mỡ | Tree |
| 298 | Xerospermum noronhianum Blume. | Sapindaceae | Vải rừng | Tree |
| 299 | Zanthoxylum nitidum (Lamk.) DC. | Rutaceae | Sẻn gai | Tree |
| 300 | Zephyranthes carinata Herb | Amaryllidaceae | Tóc tiên | Non-tree |
| 301 | Zizyphus eonoplia (L) Mill. | Rhamnaceae | Táo rừng | Tree |
| 302 | Zizyphus incurva Roxb. | Rhamnaceae | Táo vòng | Tree |